|
We trade 3x ETFs such as TQQQ TNA SOXL LABU UVXY using proprietary analysis of volatility. Subscribe to get our latest analysis, trade plans and live intraday trades. Current trade record here. Updates 7:15 PM ET - Sunday Key dates this week 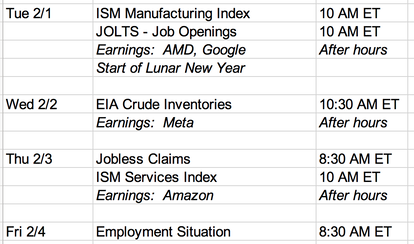 Tuesday is the start of Lunar New Year, which means there may be a lot less participation from Asian markets. This may have notable impact on futures trading. The next monthly option expiration (OPEX) date is 2/18. Expectations for next couple weeks Our system composite signal technically turned "Approaching Bullish" by end of day on 1/24. This signal still intact, and is getting more ripe. In other words, we are getting very close to "Fully Bullish". Friday's price actions ended with a big bullish move in the last 30-minutes of the trading day. This further confirms this. Our system signal is sensitive and accurate in gauging true market sentiments. It tells us that the odds are high that $SPX $NDX IWM will continue to rise for the next 1-2 weeks. Keep in mind though that the signal cannot tell us for sure the magnitude of the move (how high), or the smoothness of the move (choppy vs. steady). Expectations for next couple months So the short-term picture is improving for the stock market. However, looking out over the next couple months, there's a strong possibility that $SPX $NDX IWM may see lower lows (relative to 1/24). This is because on the weekly charts, $VIX $VXN $RVX are forming the kind of pattern that makes it possible for them to really surge. This is further confirmed by VIX futures chart. VIX futures are in backwardation, which means that traders are really worried about the market right now, as opposed to later this year. In fact, VIX futures show that they are quite worried about February and March in particular. So with OPEX coming up on 2/18, we may see our system signal turns "Fully Bullish", but does not last very long before becoming bearish again. Key price levels The key price levels are actually still the same for the indices. However, we've added SPXL to the table as we plan to trade this 3x ETF going forward. 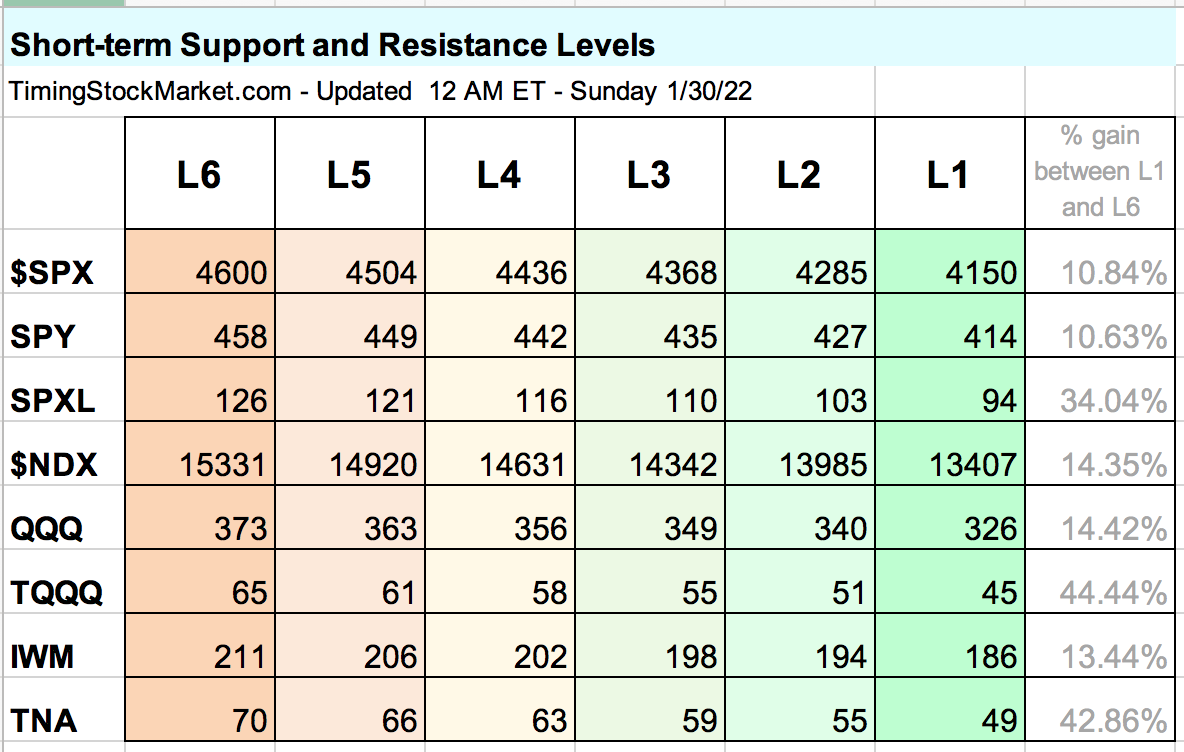 Trade Plan Click here for Signal Trades spreadsheet. Since the composite signal is a very ripe "Approaching Bullish", we will look to scale into SPXL and TQQQ on Monday. Volatility: $VVIX $VIX $VXN $RVX Read more about $VIX $VXN $RVX $VVIX here. All volatility charts have turned "Approaching Bullish" by end of 1/24. This signal is still intact. We are now looking for $VVIX chart pattern to anchor at or below its 200-hour EMA green line. Then bulls should hope that $VVIX forms a quick lower-high spike (relative to 1/24). This will shake out the weak hands and turn the signal "Fully Bullish". 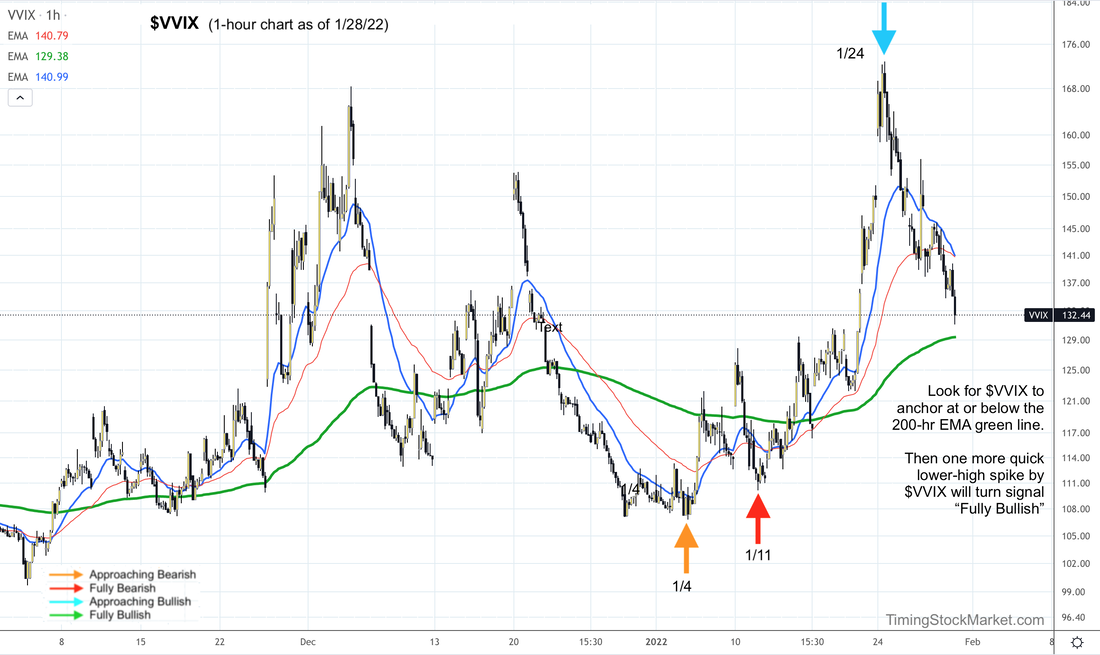 Hedging by Traders: Put/Call Ratio The signal from P/C ratio chart has turned "Approaching Bullish" by end of 1/24. This signal is still intact. Bulls should hope that P/C ratio chart forms a quick lower-high spike (relative to 1/24). This will turn the signal "Fully Bullish". 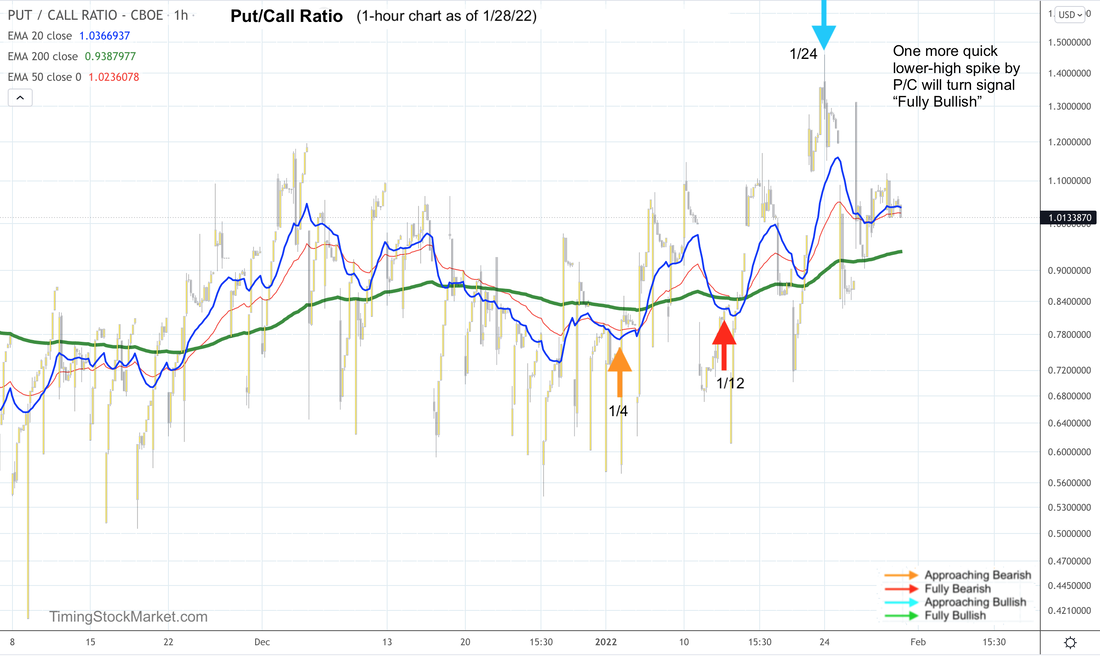 Hedging by Dealers Read more about how options are impacting the market and the effects of dealer hedging here. Below are the updated volatility trigger levels.
As of this writing, all indices are still below their trigger levels. This means dealer hedging will fuel volatility rather than dampen it. So expect big price swings to continue both up and down. Market Breadth: Advance-Decline Net Issues The signal for all A/D charts have changed to "Approaching Bullish" by end of 1/27. 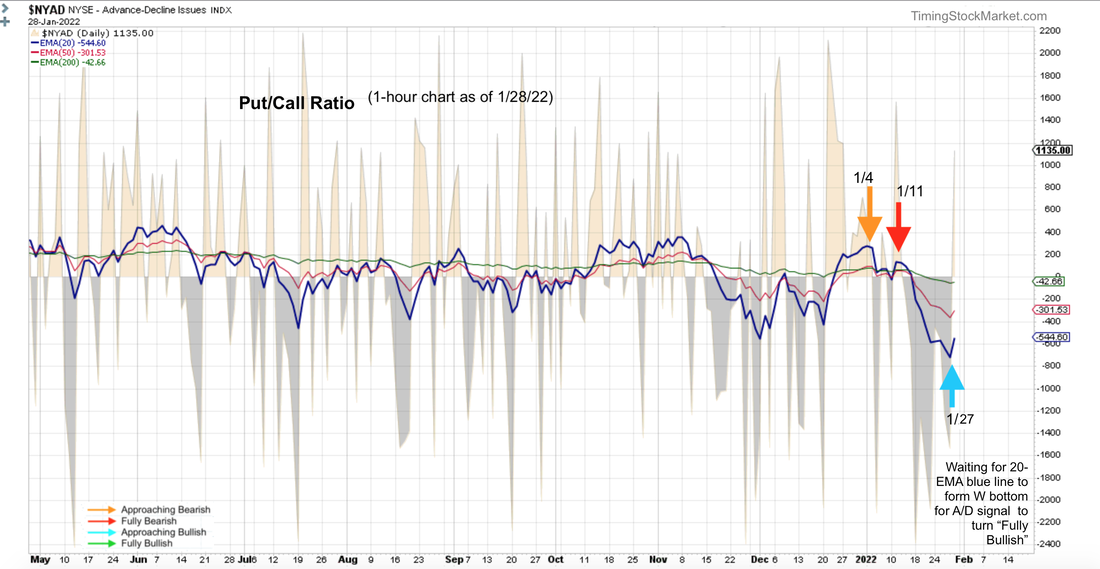 Other Signals for Big Picture Consideration The Dark Pool Index (DIX) shows silent money had a huge bullish reversal early last week. The buying has eased up somewhat. This is still an important bullish divergence. Like stock indices, most bond ETF charts (TLT IEF LQD JNK) showed bullish end of day pattern on Friday. And bond volatility (MOVE index) has formed another lower high relative to 11/26/21. This supports the short-term bullish move for stocks. Click here for Signal Trades spreadsheet. Disclaimer The information presented here is our own personal opinion. Consider it as food for thought. We are not offering financial advice. We are not promoting any financial products. We are not registered financial advisers or licensed brokers. We make no guarantee that anything will unfold according to our projections. You are proceeding at your own risk if you follow our suggestions.
0 Comments
Leave a Reply. |
Archives
April 2024
Categories |
 RSS Feed
|
|
Copyright (c) 2019-2024 LOOK Systems LLC
All rights reserved. |