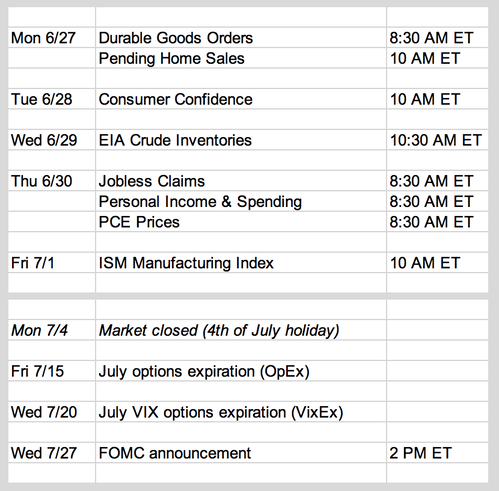
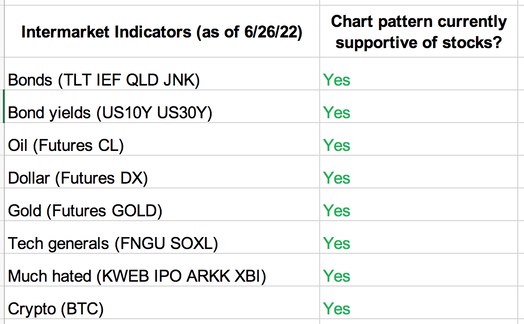
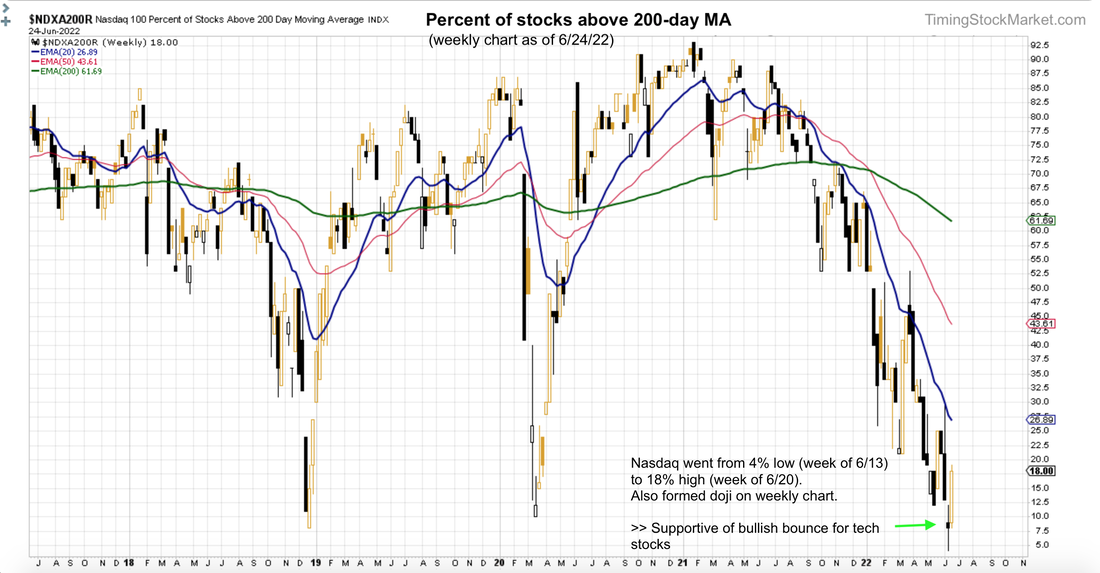
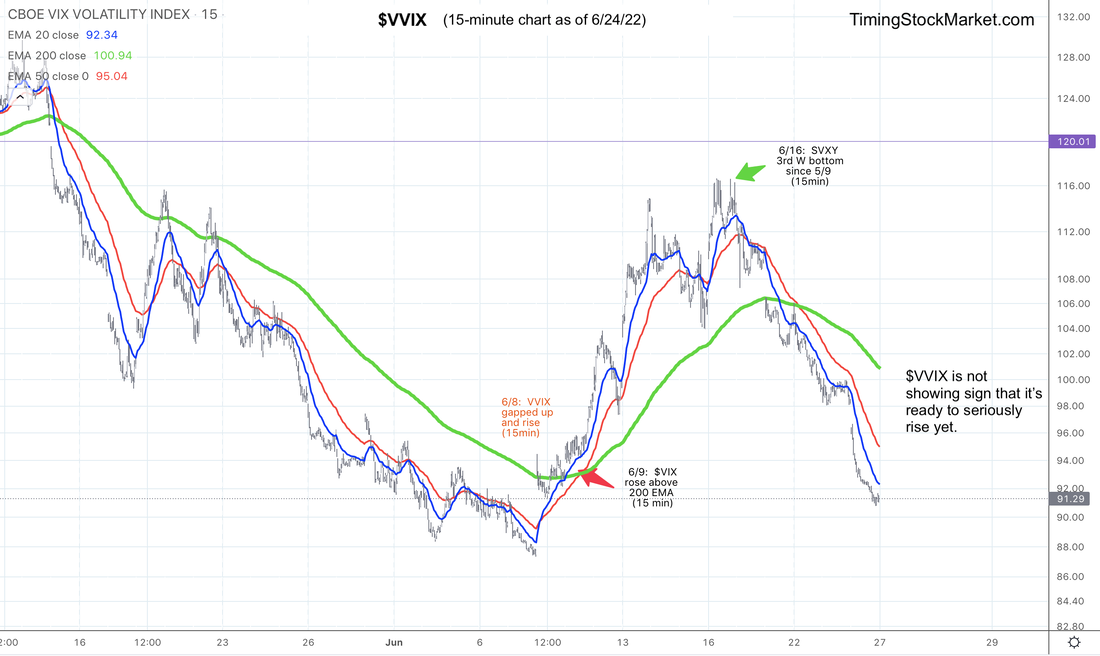
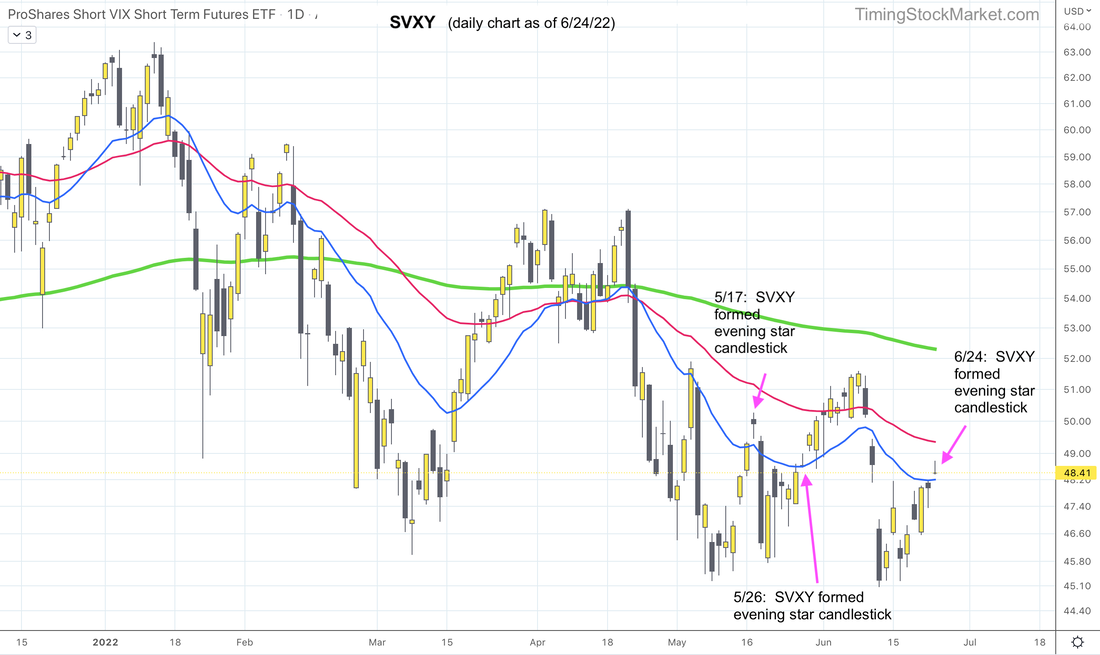
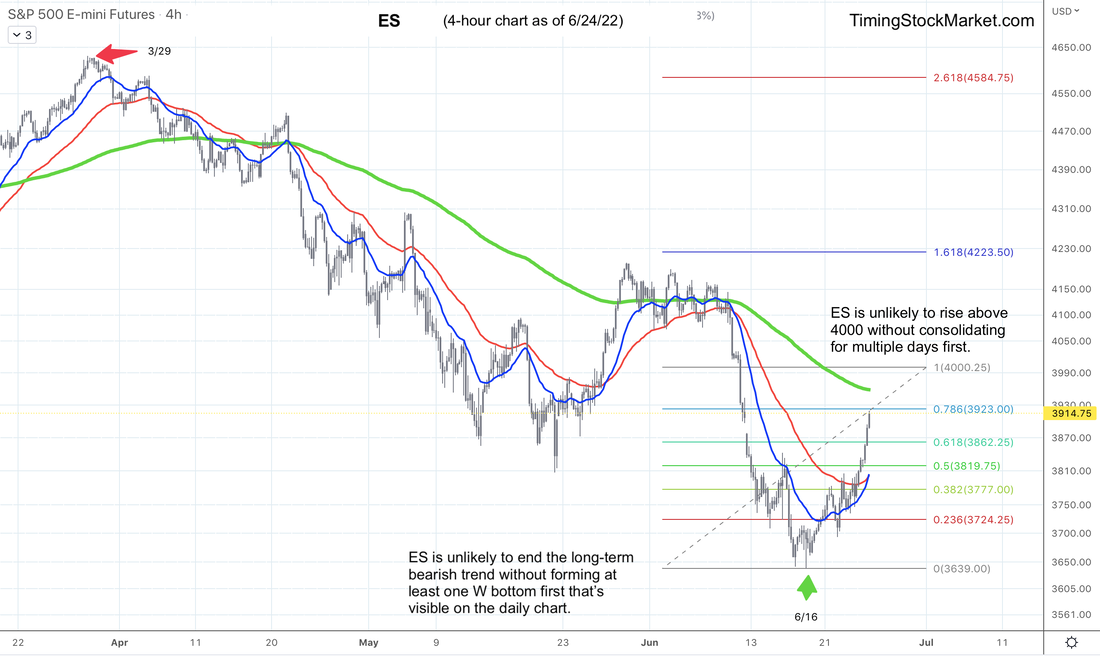
Updates 8:45 PM ET - Sunday Upcoming key events This week brings more economic data to fuel the discussions about inflation, recession and rate raise. Note also that next Monday is 4th of July holiday, and this one will be particularly poignant. Big picture: Bear market still in pause mode with short-covering rally In the updates for Tuesday 6/21, we wrote that the bear market is not done, but is likely to be getting a respite in the form of a short-covering rally during the week of 6/21. And that is pretty much what happened last week. Big picture: Intermarket indicators show bullish support Intermarket indicators are still supportive of the current rally, as they were last week. Big picture: Market breadth shows bullish support Market breadth has certainly been improving. The percentage of Nasdaq stocks above the 200-day MA went from a 4% low (week of 6/13) to 18% high (week of 6/20). Similarly, NYSE stocks went from 5% low to 23% high. Also, the weekly chart doji pattern shown below is also bullish. Short-term volatility signal: "Fully Bullish" $VIX is forming a topping pattern. $VVIX is steadily dropping. Both charts are providing bullish support for stocks. But we should monitor SVXY closely. It formed an evening star candlestick on its daily chart on Friday 6/24. On 5/17, this pattern lead to a drop in SVXY (bearish for stocks). On 5/26, SVXY ignored this pattern and kept marching upward. Bear market done? We really don't think so. A lot of puts expired in the last two Fridays, and that accounted for the drive behind the current rally, which started on 6/16. There is end-of-month expiration happening this Thursday 6/30 (for June). There is end-of-week expiration happening this Friday 7/1. As these put options expire, dealers will rebalance their books by covering their stock futures shorts. This is buying into strength, and it fuels very sharp price increase. (See articles explaining this phenomenon here.) While we think it is possible for ES to rise up to 4000 this week, it is likely to run into strong resistance there, and will consolidate for multiple days before breaking out or breaking down. Furthermore, even if the bear market was done, it is extremely unlikely for ES to march straight up (V recovery) without forming a W bottom, or cup-and-saucer pattern near 3639 first. Trade plan Click here for live trades. Subscribe to get our latest analysis, daily trade plans and live intraday trades. Current trade record here. Disclaimer The information presented here is our own personal opinion. Consider it as food for thought. We are not offering financial advice. We are not promoting any financial products. We are not registered financial advisers or licensed brokers. We make no guarantee that anything will unfold according to our projections. You are proceeding at your own risk if you follow our trades.
0 Comments
Leave a Reply. |
Archives
April 2024
Categories |
 RSS Feed