|
Members click here for full article.
(It is currently free to join our membership.) Here is an excerpt from our trading plan. We are in Surge4, not Surge1 There’s something that has been bothering us. $SPX $NDX $RUT started an Up Trend on 12/26/18, and had been marching up steadily with Dip1 on March 4 and Dip2 on March 21. These are typical dips in an Up Trend, shallow and lasted only a few days. When the bigger sell-off happened in May, we labeled it Down Trend. But that term bothers us, because that sell-off lacked the characteristics that typically accompany real Down Trends. It didn’t last as long as the Down Trend from 10/4/18 to 12/24/18. It didn’t drop as far as that Down Trend either. It didn’t have the kind of patterns for volatility and A/D lines that confirm it’s a real Down Trend. To call the May sell-off a Down Trend is misleading, because it implies that the rise in price for $SPX $NDX $RUT since June 4 is a new Up Trend. And as a new Up Trend, it has the potential of lasting for quite a while, and rising substantially. This is not the case. In fact, based on the cycles defined by our trading system, which relies on volatility and other market internal indicators, the sell-off in May is exactly that. We’ll call it SellOff to signify that is is a medium size retracement in an Up Trend. It is bigger than a Dip, which is just a small retracement. What happened in May though was not a Down Trend. So as of now, we are in Surge4 of the Up Trend. It is important to make this distinction because we are now working with the assumption that this is not a fresh new Up Trend that can last for quite some time. Instead, our trading system is telling us that this Up Trend that started on 12/26/18 is about 60% done. It can still last another 3-4 months, but most likely not beyond that. The rest of this article covers: Market internals Dip4: support and resistance levels Trading plan Register here to read the rest of the article. All free.
0 Comments
Members click here for full article.
(It is currently free to join our membership.) Here is an excerpt from our trading plan. Based on today’s price actions for $SPX $NDX $RUT, and based on the messages seen in market internals, we have to examine the possibility that Surge1 of the new Up Trend may not actually be done yet. Surge1 started on Tuesday 6/4/19. By 6/11, $SPX has retraced 78.6% of the May sell-off. Most traders (including us) assume that this was the likely end of Surge1. $SPX $NDX $RUT started to head down 6/11 and 6/12, volatility rose a bit, market breadth dropped, and trader sentiments got more bearish. All signs of a possible Dip1 happening. However, our trading system now detects a different message from market internals. The rest of this article covers: Market internals Surge1: support and resistance levels Trading plan Register here to read the rest of the article. All free. Members click here for full article.
(It is currently free to join our membership.) Here is an excerpt from our trading plan. Today is one of those lethargic days where market didn't seem to do much, or send any decisive message. It's hard in this kind of situation to anticipate the next move because there's not a whole lot of price actions to work with. These are the days where we really need to dig into our market internals for more data. Market internals Volatility: After rising a bit yesterday, $VIX went down today. $VXN however has been steadily marching up since the gap down at open yesterday. So what are they saying? Market is nervous, but still indecisive about really selling. The rest of this article covers: Market breadth Trader Sentiments Dip1: support and resistance levels Trading plan Register here to read the rest of the article. All free. Members click here for full article.
(It is currently free to join our membership.) Here is an excerpt from our trading plan. Dip1 has arrived Yesterday evening 6/10 we wrote: “even if Surge1 stretches upward a little more tomorrow, we don’t think it’s a good idea to chase it up from here.” Surge1 did stretch upward when $SPX $NDX $RUT gapped up this morning. But then they promptly dropped. By 11 AM EST, we saw a number of confirming factors that Dip1 was starting. In “Market internals” we will provide more explanations of what we saw as confirmations. But first, let’s look at the big picture. Rate cut is not guaranteed Rate cut is not guaranteed, especially in the upcoming FOMC meeting next week June 18-19. Goldman says today that “although it is a close call, we still expect the FOMC to keep the funds rate unchanged in the remainder of the year.” Over the last three weeks, as JPMorgan, Barclays, Credit Suisse, BofA and others have been saying rate cut is very likely this year, but Goldman has not joined in this chorus. All this bullishness since June 4 has been due to the Fed’s promise of a potential rate cut. Not getting one in June, or not having this promise reinforced, may result in another nasty tantrum by the market. But the Fed is facing uncharted dangerous territory in trying to maintain their independence and the market’s trust in that independence. In many ways, they are damned if they cut rates, and damned if they don’t. All of this is a roundabout way of saying that next week’s FOMC meeting on June 18-19 is gonna be a doozy. Keep that in mind if you are planning to build any long-term position. The rest of this article covers: Market internals Dip1: support and resistance levels Trading plan Register here to read the rest of the article. All free. Members click here for full article.
(It is currently free to join our membership.) Here is an excerpt from our trading plan. Market internals Volatility: $VIX $VXN have actually stopped dropping today. They may rise a bit over the next few days, but they are not forming the kind of pattern that typically precedes a huge surge in fear. This confirms our theory that stocks are in Surge1 of an Up Trend. But it also indicates that Surge1 may be done for now, and $SPX $NDX $RUT may be transitioning into Dip1 soon. Market breadth: Both NYSE and Nasdaq cumulative A/D lines continue to rise, indicating a healthy participation by the number of stocks in the current up swing. The percentage of bullish NYSE stocks is rose to 55.9% today, and the percentage of bullish Nasdaq stocks is at 66% still. These numbers are healthy, and not yet at the overbought level. This is additional confirmation that $SPX $NDX $RUT are in Surge1 of an Up Trend. The rest of this article covers: Market internals (more) Surge1: support and resistance levels Trading plan Register here to read the rest of the article. All free. Members click here for full article.
(It is currently free to join our membership.) Here is an excerpt from our trading plan. Slowing Growth vs. Rate Cut Friday's job report provides additional confirming data that the US economy is slowing, primarily as a result of the tariff war. From the Wall Street Journal:
It will take some time, but there is no doubt this slowdown will have global impact, and is likely to bring about the end of the 10-year old bull market. In the short term though, the promise of potential rate cuts by the Fed can provide tailwind for stocks for now. The rest of this article covers: Market internals Surge1: support and resistance levels Trading plan Register here to read the rest of the article. All free. Members click here for full article.
(It is currently free to join our membership.) Here is an excerpt from our trading plan. The primary difference between May 16 and now You may recall that Bounce1 for the May Down Trend lasted only from May 13 to May 16 before Drop2 took over. We may very well see Drop3 of the Down Trend soon. However, let's look at the real reason for the current upward thrust in price and the steady buying. From Wall St. Journal today: "Traders in futures markets have placed about a 25% chance of a rate cut at the June 18-19 meeting, and a 75% chance of at least one cut by the meeting after that, on July 30-31, according to CME Group . Unlike in May, officials haven’t expressly pushed back against market pricing on rate cuts in recent days. Instead, Fed officials ...signaled ...that they are attentive to the risks of a sharper-than-expected slowdown in growth, a sign that an interest-rate cut could be on the table at coming meetings." This is the fuel for the current up swing. This is the difference between now and May 16, the last date of Bounce1. Again, you have seen the power of the Fed to create melt-up and melt-down from their actions during previous Fed meetings. Even if we don't morally approve of market being happy on this sugar high, as traders we have to trade what's in front of us. The rest of this article covers: Market internals Surge1/Bounce2: support and resistance levels Trading plan Register here to read the rest of the article. All free. Members click here for full article.
(It is currently free to join our membership.) Here is an excerpt from our trading plan. Underlying imbalances Back in early May during the terrible tweet storm, we wrote about how volatility ($VIX $VXN) was not surging. There was no sign of true panic under the hood. Market internals were looking healthy. Only that trader sentiments were getting extremely bearish. We wrote that this unique combination creates a bullish divergence, which can be highly profitable for bulls. On Monday 6/3, Drop2 of the May Down Trend ended. On Tuesday 6/4, $SPX $NDX $RUT launched themselves into Bounce2 which can be viewed as a typical corrective bounce of a down trend. However, it may very well turn out to be Surge1 of the new Up Trend, because of the Fed hinting at rate cuts. Adam Grimes (author of the excellent TA book "The Art and Science of Technical Analysis"), wrote: "This is important. In fact, it is the single most important point in technical analysis — the holy grail, if you will. Every edge we have, as technical traders, comes from an imbalance of buying and selling pressure. That’s it, pure and simple. If we realize this and if we limit our involvement in the market to those points where there is an actual imbalance, then there is the possibility of making profits. We can sometimes identify these imbalances through the patterns they create in prices, and these patterns can provide actual points around which to structure and execute trades. Be clear on this point: we do not trade patterns in markets — we trade underlying imbalances that create those patterns.” Keep this in mind as you hone your own trading system and craft your trading plans. Our goal should be to use technical patterns and technical data to identify the underlying imbalances and trade them. To focus on just the price actions of charts alone seems to be a bit short-sighted to us. Therefore we always try to look under the hood. That's where we can identify the underlying imbalances. And in our experience, these underlying imbalances can show up days or weeks in advance of a major move. So anytime you hear "bullish divergence" or "bearish divergence", those are hints that there is a big underlying imbalance forming. They offer low-risk, high-probability, high-reward setups to trade. Trading Plan So the questions to ask now are:
Register here to read the rest of this article, and to get the full details of our trading plan. All free. Members click here for full article.
(It is currently free to join our membership.) Here is an excerpt from our trading plan. Bounce2 has launched Yesterday we wrote: "Tomorrow Tuesday is likely to be Turnaround Tuesday, and Bounce2 has a good chance of starting." That's pretty much what happened today Tuesday. Bounce2 launched its first upward thrust, and it was a powerful launch. In fact, both S&P 500 and Nasdaq 100 E-mini futures have been up most of tonight. The odds are high that we will see a gap up at open tomorrow. You may recall we wrote a lengthy weekend analysis to discuss all the market internal factors that were shouting "bullish" rather than "bearish". Combine them with the oversold conditions from May 3 to June 3, the extreme bearish sentiments and we have the equivalent of a nice pile of dry wood. Along came the Fed this morning to light the match. Jerome Powell hinted at the possibility of rate cuts, and stocks took off while bonds fell. We have been lately working with the assumption that the May sell-off is a Down Trend. We showed you the following table to highlight the Drop/Bounce sequence of this Down Trend so far. These values are still valid. The questions to ask now are:
Register here to read the rest of this article. All free. Members click here for full article, click here for latest updates. (It is currently free to join our membership.) Here is an excerpt from our trading plan. Drop2 is transitioning to Bounce2 In our Sunday weekly analysis, we mentioned that $SPX $NDX $RUT were approaching the end of Drop2. We listed the following projections for support levels. $SPX: Drop2 support projected at 2720, reached low of 2729 Mon and rose. $NDX: Drop2 support projected at 6941, reached low of 6937 Mon and rose. $RUT: Drop2 support projected at 1460, reached low of 1460 Mon and rose. Here are the bullish confirmations and the updated values to show how high $SPX $NDX $RUT can get up to during Bounce2. 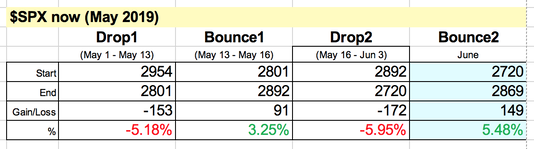 |
Archives
April 2024
Categories |
 RSS Feed
|
|
Copyright (c) 2019-2024 LOOK Systems LLC
All rights reserved. |