|
We trade 3x ETFs such as TQQQ TNA SOXL LABU UVXY using proprietary analysis of volatility.
Subscribe to get our latest analysis, trade plan and live intraday trades. Current trade record here.
0 Comments
We trade 3x ETFs such as TQQQ TNA SOXL LABU UVXY using proprietary analysis of volatility. Updates 12 AM EST - Thursday 12/9/21 Read more about $VIX $VXN $RVX $VVIX and the effects of options and hedging on the market here. Hedging by Traders and Dealers Fear evaporated almost as quickly as it arrived. Last week, traders and fund managers were very fearful, and they rushed to hedge by buying puts at a high cost due to super high sudden volatility spike. Dealers had to hedge their books in a way that fueled volatility even more, and caused the melt-down in price. But those expensive puts are tough to hold on to when stocks started to turn slightly more bullish. So traders covered their puts or let them expire. Dealers reversed their hedging in a way that caused a big melt-up in price. Now market conditions have reached a state where gamma is positive. This means dealers will be buying into weakness, and selling into strength. This process dampens volatility and keeps stock prices from melting, up or down. However, FOMC is next Wednesday. Traders and managers will want to hedge for this event some amount. So despite the drop in P/C ratio we saw in the last couple of days, we are likely to see the P/C ratio rise again. In fact, we want to see it rise again, similar to what's shown in the 30-minute chart below. We consider the arrival of this pattern a signal that conditions have turned "Fully Bullish". 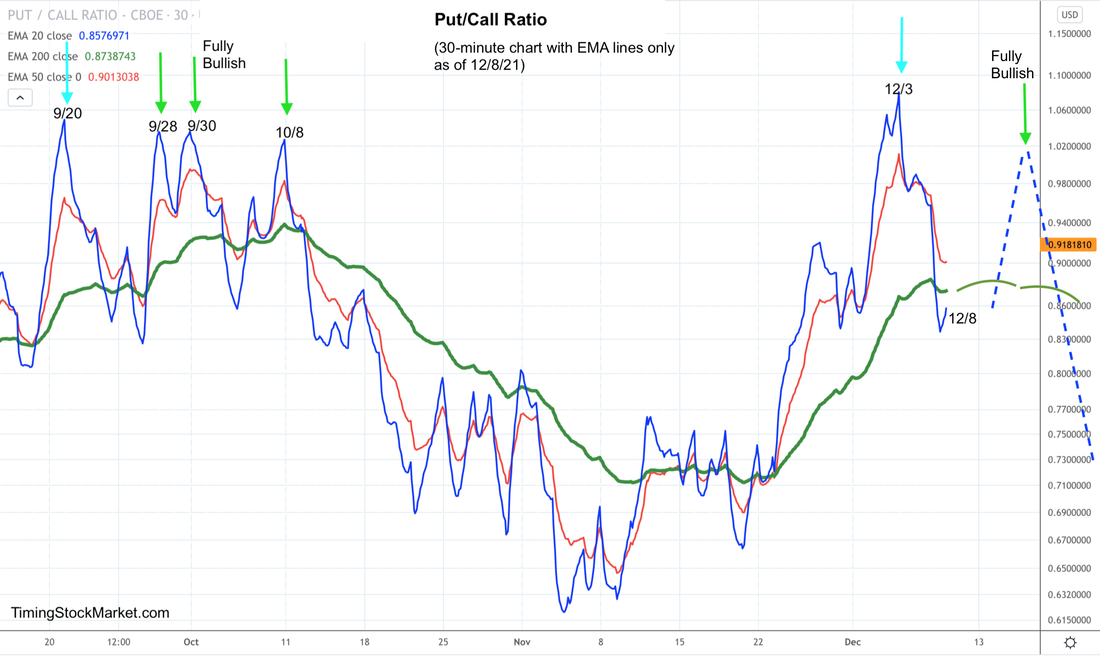 Volatility: $VVIX $VIX $VXN $RVX When traders start buying puts again to hedge FOMC, $VIX $VXN $RVX $VVIX are all likely to rise again, similar to the chart pattern shown below. We want to see that pattern show up, just like P/C ratio chart above. We consider that pattern to be the signal that conditions have turned "Fully Bullish". 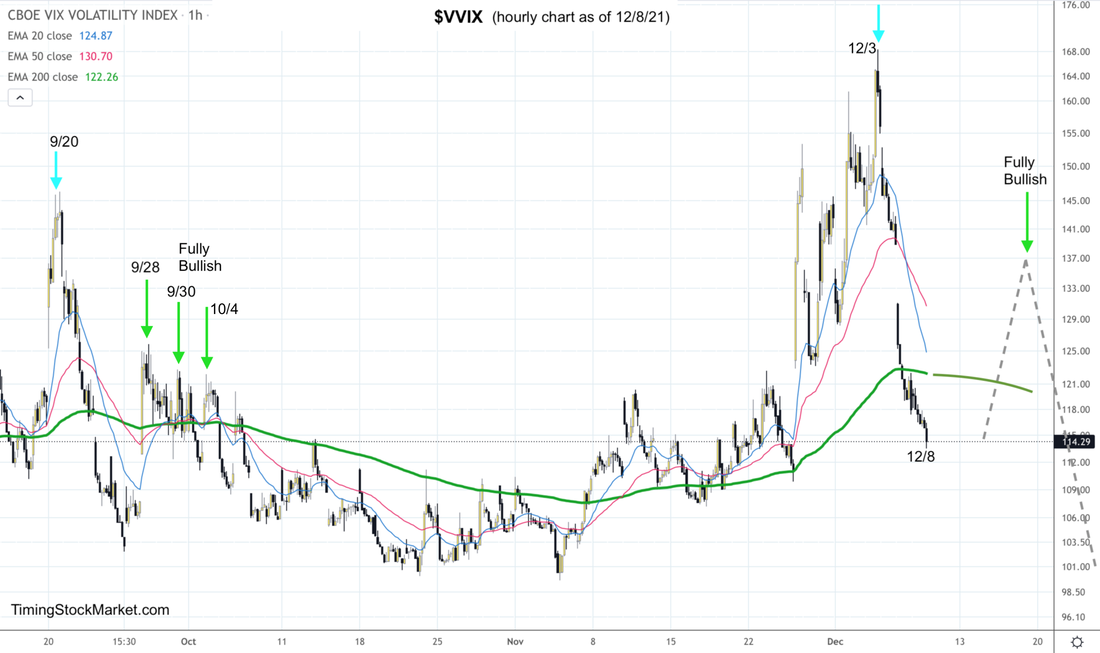 Market Breadth: Advance-Decline Net Issues As discussed we've been discussing for the last few days, the daily charts of A/D net issues for NYSE, Nasdaq and S&P small caps are looking more bullish each day. Below is the daily chart for A/D net issues for Nasdaq. This is the area chart. Observe the W bottoms that is forming. Similar bottoms are forming for NYSE and small caps. This is a "Fully Bullish" signal for market breadth. 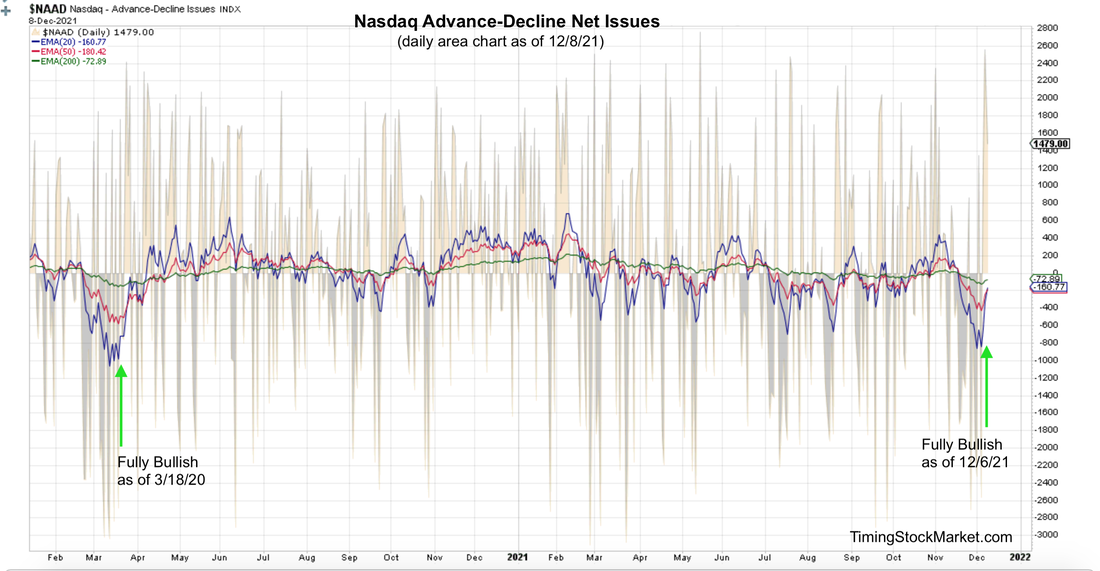 Other Bullish Signals
Short-term Key Levels and Trade Plan Subscribe to get our latest analysis, trade plan and live intraday trades. Current trade record here. Disclaimer The information presented here is our own personal opinion. Consider it as food for thought. We are not offering financial advice. We are not promoting any financial products. We are not registered financial advisers or licensed brokers. We make no guarantee that anything will unfold according to our projections. You are proceeding at your own risk if you follow our suggestions. We trade 3x ETFs such as TQQQ TNA SOXL LABU UVXY using proprietary analysis of volatility. Updates 1:45 AM EST - Thursday 12/2/21 What's going on with the big dives in $SPX and IWM? Let's step back to a happier time in early November, when all the stock indices were marching up steadily. You may recall that we were posting Put/Call ratio charts that had very low put values relative to calls. What that showed was that traders were not bothering with buying puts to hedge. In fact, they were greatly under hedged as it turned out. Instead of buying puts to hedge, traders were buying calls. In response, dealers hedged their books in a way that resulted in dealers selling into market strength. This is the effect of positive gamma, where price swings are small and market grinds up slowly. Then OPEX came on 11/19 where all the November options expired, clearing the dealer hedging, and everyone started all over with a new monthly cycle. Things were still looking pretty calm until 11/26, when news of the Omincron variant broke. Traders rushed to buy a ton of puts on a partial trading day with very poor liquidity. Implied volatility shot up, and gamma dropped. $SPX and IWM dropped sharply because everyone assumes things will be locked down again like March 2020. As $SPX and IWM drop, traders buy more puts and dealer hedge their books in a way that results in them selling into market weakness. This is the effect of negative gamma. It leads to very big price swings, up or down. At this point, gamma is still very negative, but it is approaching the gamma level of September low, and will probably reach it soon. Then gamma will likely rise again. And when gamma rises while $SPX IWM are way oversold, $SPX IWM can rise up sharply. This is how those big sharp V or W bottoms form after a major sell-off. The obvious question is when. No one can really give us a precise answer. But we will get a clue when the 20 EMA line on the Put/Call ratio chart starts to form lower highs, along with $VVIX $VIX $VXN $RVX charts. See the P/C ratio 2-hour chart below. 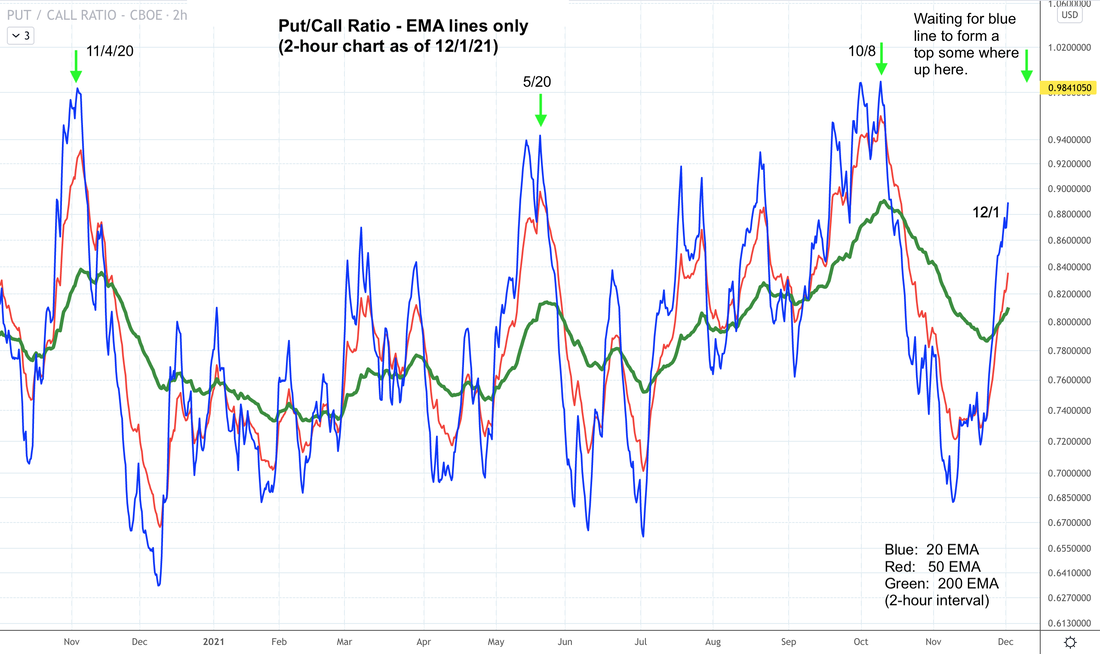 Volatility: $VVIX $VIX $VXN $RVX All volatility charts have shot up sharply higher late Wednesday afternoon, after the news came out that the first case of Omicron has been identified in CA. Traders used this excuse to hedge more, which meant implied volatility shot up, and gamma turned even more negative, and $SPX IWM dropped hard from the effects of negative gamma. One thing to note is that spot $VIX closed on Wednesday at 31.13, which is much higher than any VIX future. July VIX future is the highest, and it is still only at 27.4. What this tells us is that implied volatility from spot $VIX is reflecting the current short-term panic. Traders are rushing to buy short-term puts to protect their portfolios. All that hedging raises implied volatility of $SPX. Meanwhile, VIX future traders are not experiencing the same needs. And they don't anticipate volatility to rise that high, even as far out as July. UVXY has dropped after hours. VIX futures are dropping overnight as we write this. We are planning to hedge our holdings with UVXY, if UVXY retests the zone between 17.5 and 18, and finds support to anchor there. That may be a setup for UVXY to form a higher high. But we do have to be careful with UVXY as gamma approaches its negative bottom. When volatility starts to ease up, UVXY will drop hard. So our UVXY trades will be for intraday holding only. 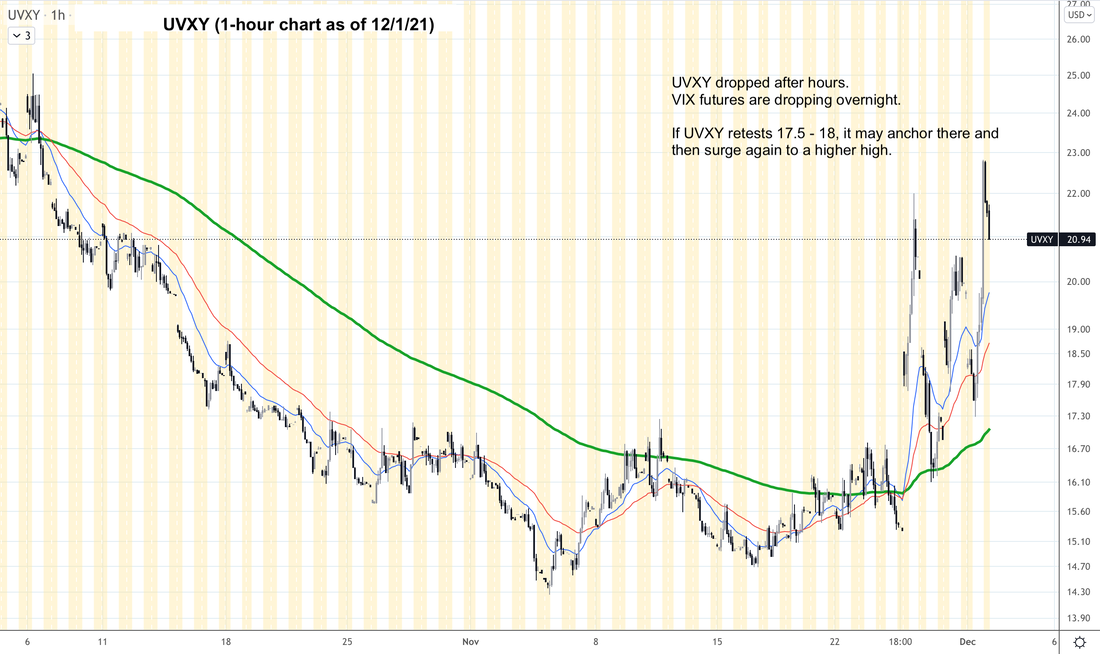 Market Breadth: Advance-Decline Net Issues NYSE, Nasdaq and small-cap A/D net issues dropped substantially on Tuesday, but again not as low as Friday. Perhaps this is a hint that breadth is slowly improving from "horrible" to "just plain bad". Short-term Key Levels The table below is fully updated. 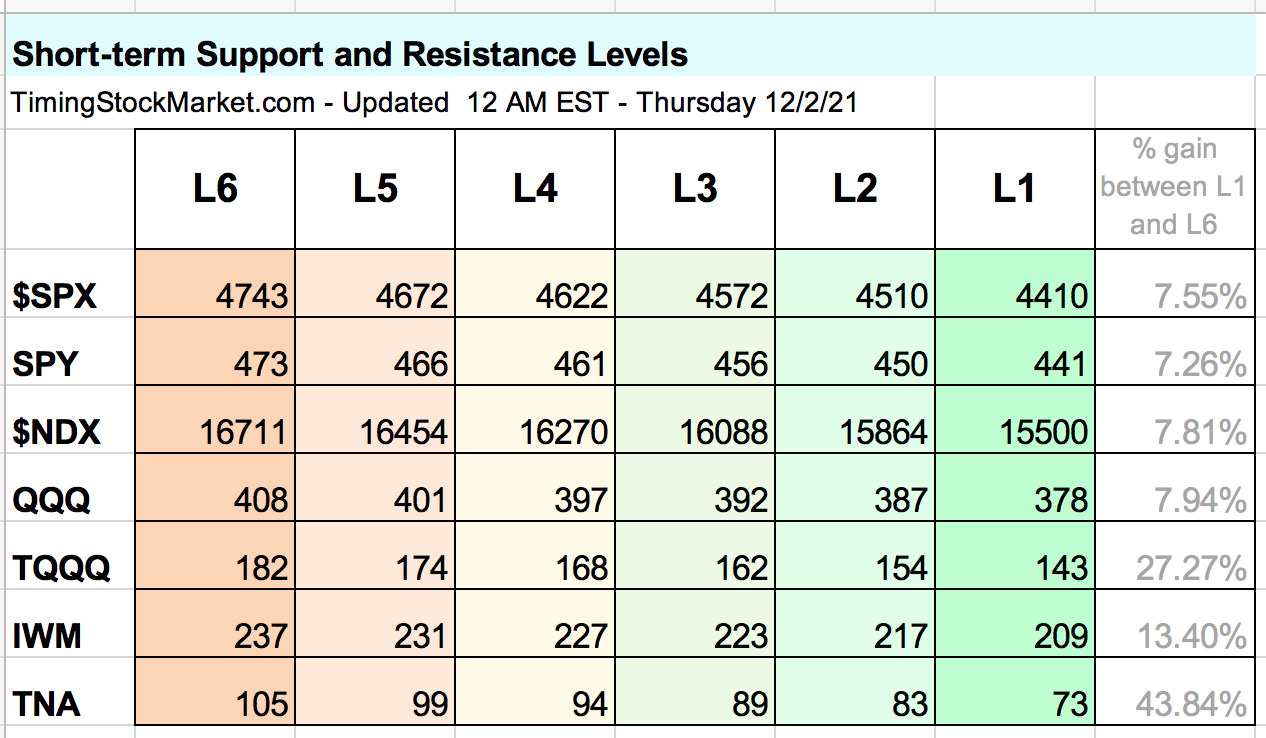 Trade Plan
Subscribe to get our latest analysis, trade plan and live intraday trades. Current trade record here. Disclaimer The information presented here is our own personal opinion. Consider it as food for thought. We are not offering financial advice. We are not promoting any financial products. We are not registered financial advisers or licensed brokers. We make no guarantee that anything will unfold according to our projections. You are proceeding at your own risk if you follow our suggestions. |
Archives
February 2024
Categories |
 RSS Feed
|
|
Copyright (c) 2019-2024 LOOK Systems LLC
All rights reserved. |