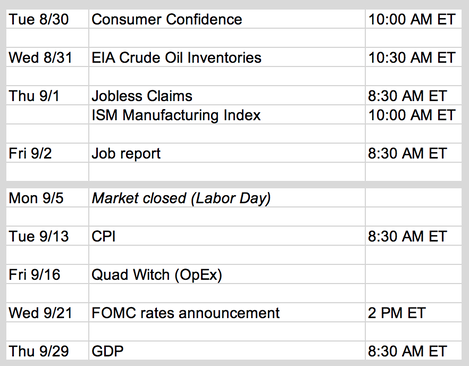
Updates 10:30 PM ET - Sunday Upcoming key events The big picture: bearish The big rally from 6/16 to 8/19 seemed to have been built on two premises: inflation has peaked, and the Fed will soon pivot to dovish. Powell's speech on Friday put to rest that false assumption. It is interesting to read the following WSJ article, which offers an opinion on why the Fed's tough talk may be temporary. However are some additional data points to keep in mind.
July PCE may have shown price softening a bit, but looking at the latest charts for key items from above, we think that inflation is likely to rise a bit more again. Hard to keep price down when copper and corn are rising, and oil may soon join the party. Market breadth is dropping sharply >> bearish
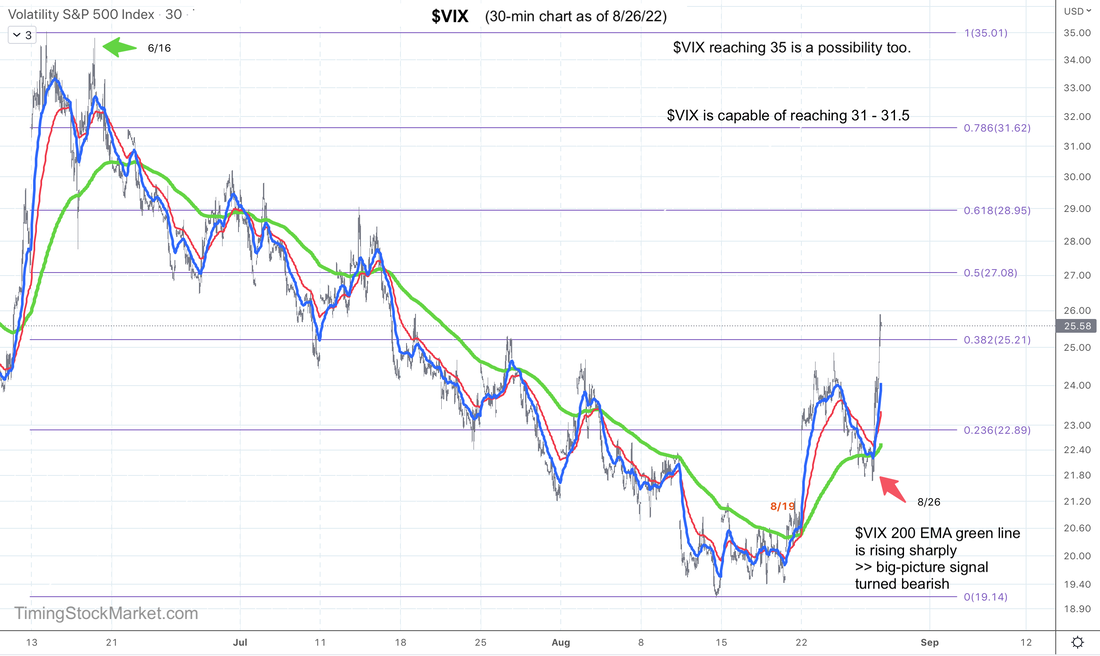
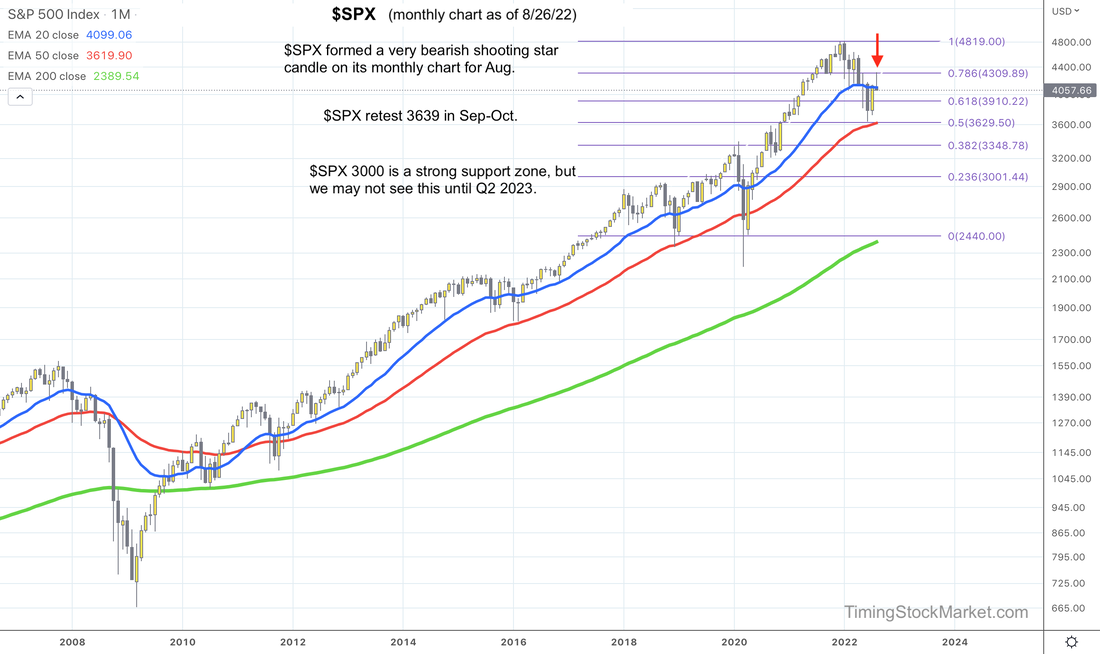
Rising volatility >> bearish In $VIX 30-minute chart below, $VIX 200 EMA green line is rising sharply. This turns our big-picture signal to bearish. $VIX is certainly capable of reaching 31-32 at this point. In fact, it may go as high as 35 before the big-picture signal turns bullish again. How low will price go? $SPX has formed a very bearish shooting star candle on its monthly chart for August as shown below. Nasdaq and small-cap charts show the same pattern. Market is now in a bearish regime. So how low can price go? We think there is a good chance that $SPX and the rest of the indices will retest the lows of mid-June in September, or at the latest in October. Where price goes after that depends on the success of this critical retest. Trade plan Click here for live trades. Subscribe to get our latest analysis, daily trade plans and live intraday trades. Current trade record here. Disclaimer The information presented here is our own personal opinion. Consider it as food for thought. We are not offering financial advice. We are not promoting any financial products. We are not registered financial advisers or licensed brokers. We make no guarantee that anything will unfold according to our projections. You are proceeding at your own risk if you follow our trades.
0 Comments
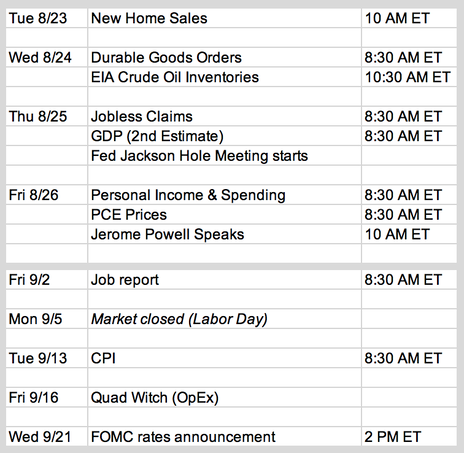
Updates 12:30 AM ET - Monday 8/22/22 Upcoming key events The big picture: transition to bearish is possible, but not guaranteed There are different "wind conditions" pushing on equity market right now. Bullish tailwind:
Bearish headwind:
It is very difficult to trade stocks based on macro conditions. However, it is important to monitor the strength of the US dollar. USDJPY and USDEUR have been climbing up at a sharp rate since 8/11. This is a strong bearish warning for stocks. Note also that Powell is scheduled to speak this Friday. This will be treated almost like FOMC rate announcement since the real FOMC is not until 9/21. Market breadth is dropping sharply >> bearish
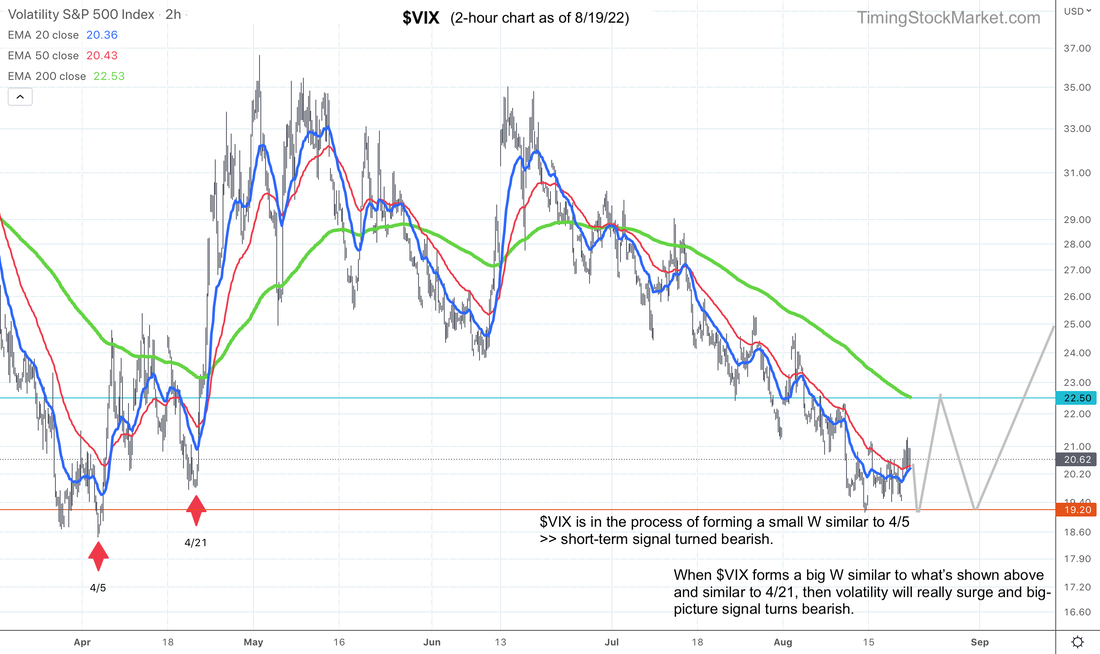
Volatility: $VIX is basing to rise short term Market is entering a tricky period here. It could be undergoing a big dip to ease up the overbought condition, brings on more buyers and resumes the bullish trend with renewed vigor. Or this could be the setup to launch a new bearish trend. There is no easy way to tell. But we have found in the past that $VIX does send out some reliable signals to look for in this kind of condition. On Friday, we discussed how it's time to closely monitor $VIX various 200 EMA lines. Another way to monitor it is to look for the small W and big W patterns as described below. Right now, $VIX is in the process of forming a small W similar to the one formed between 3/19 and 4/5. $VIX needs to tag the zone between 19.2 - 19.5 quickly and then turn up. That will complete the small W pattern. This process is turning the short-term signal bearish. From the small W pattern, $VIX is likely to rise up to about 22 - 23. If $VIX drops from there to retest the zone of 19 - 20 one more time and surges out of there, then it is forming a big W similar to 4/21. Volatility will really surge and the big-picture signal will turn bearish. There is no way to determine ahead of time if $VIX will form the big W pattern or not. It may just drop from the 22-23 zone and keep dropping past 19. Therefore we must remain unbiased and let $VIX chart tells us where it is going.
Key levels After $VIX finishes forming the small W, it is likely to spike up to 22-23, and price is likely to drop to these levels to look for support:
Trade plan Click here for live trades. Subscribe to get our latest analysis, daily trade plans and live intraday trades. Current trade record here. Disclaimer The information presented here is our own personal opinion. Consider it as food for thought. We are not offering financial advice. We are not promoting any financial products. We are not registered financial advisers or licensed brokers. We make no guarantee that anything will unfold according to our projections. You are proceeding at your own risk if you follow our trades. |
Archives
July 2024
Categories |
 RSS Feed