|
In our weekend analysis posted Sunday 5/31/20, we showed our readers $SPX $NDX IWM red zones to watch out for as the place for potential short term bearish reversal. As soon as $SPX $NDX entered their red zones today (6/1), they got stuck like flies to a fly trap. 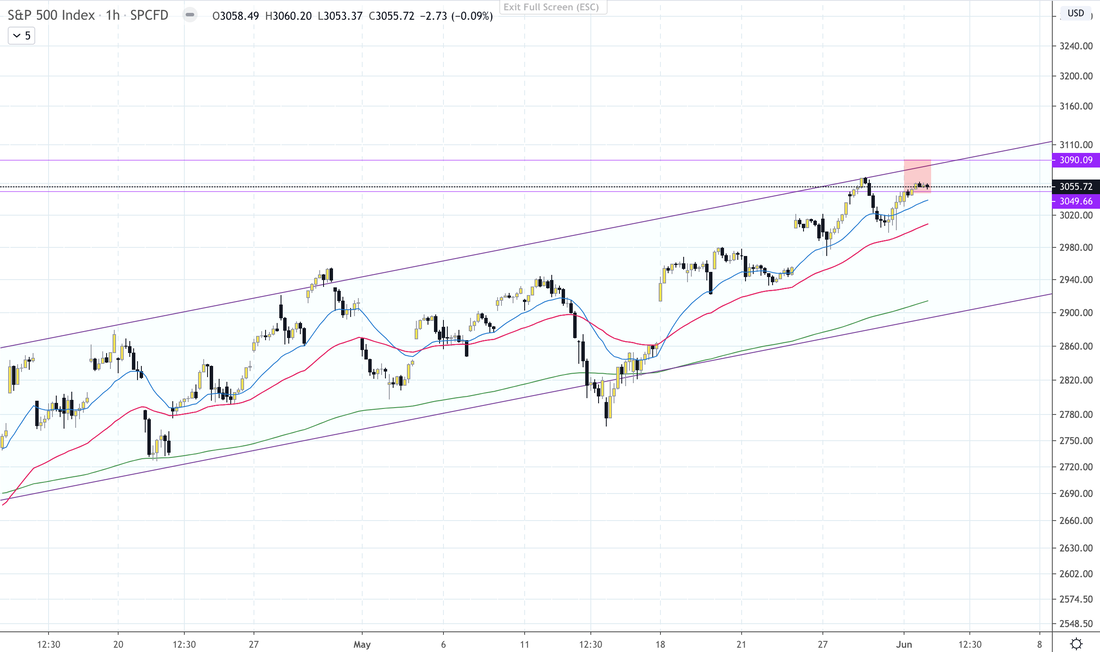 SUBSCRIBE now to get our signals in advance of your trading day. Get live trade updates and take advantage of our introductory low rate of just $39/month. You can cancel at any time.
1 Comment
See FAQ for more explanations on terms, labels and abbreviations that we use. We called this bearish reversal with our post pre-market at 1:46 AM on Thursday 5/28/20. We shared the following hourly charts of $SPX $NDX IWM with red circles drawn to show the areas where Bounce5 was likely to end. During trading hours on Thursday, $SPX $NDX IWM reached the red circles and promptly reversed downward as we projected. This marked the end of Bounce5. Even though this setup did not meet our more stringent criteria for a multi-day ST trade, it was plenty of advance warnings for day traders and very ST swing traders to put on a profitable trade. For example, entering into TZA at open when IWM gapped up into the red circle on the chart, and selling during the first hour of Friday would have resulted in a 16.5% gain. 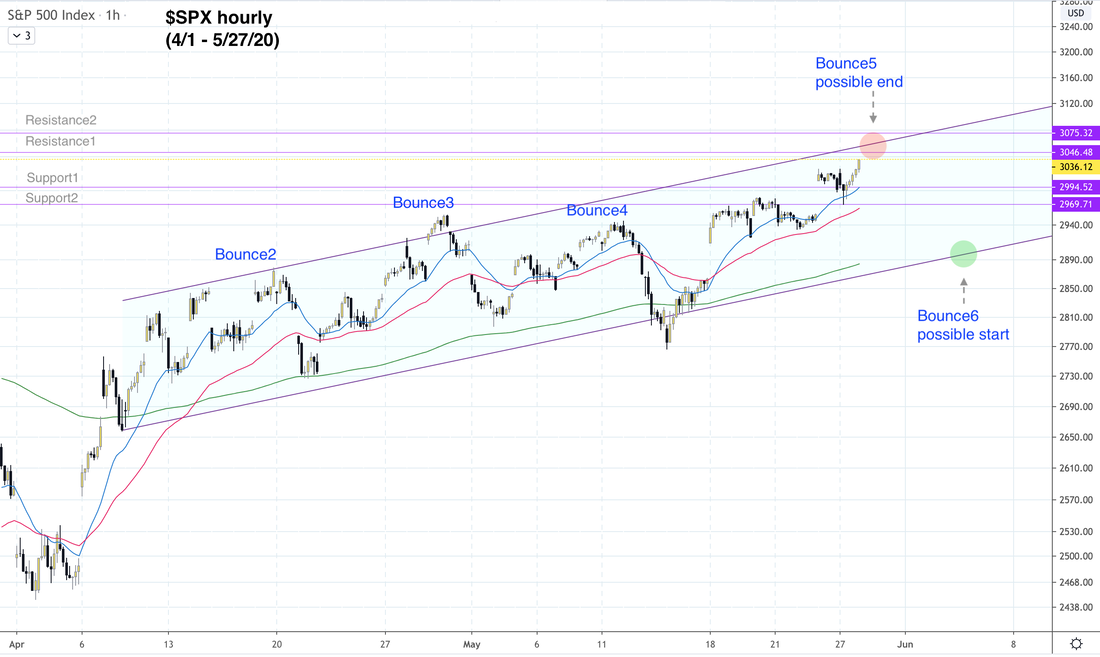 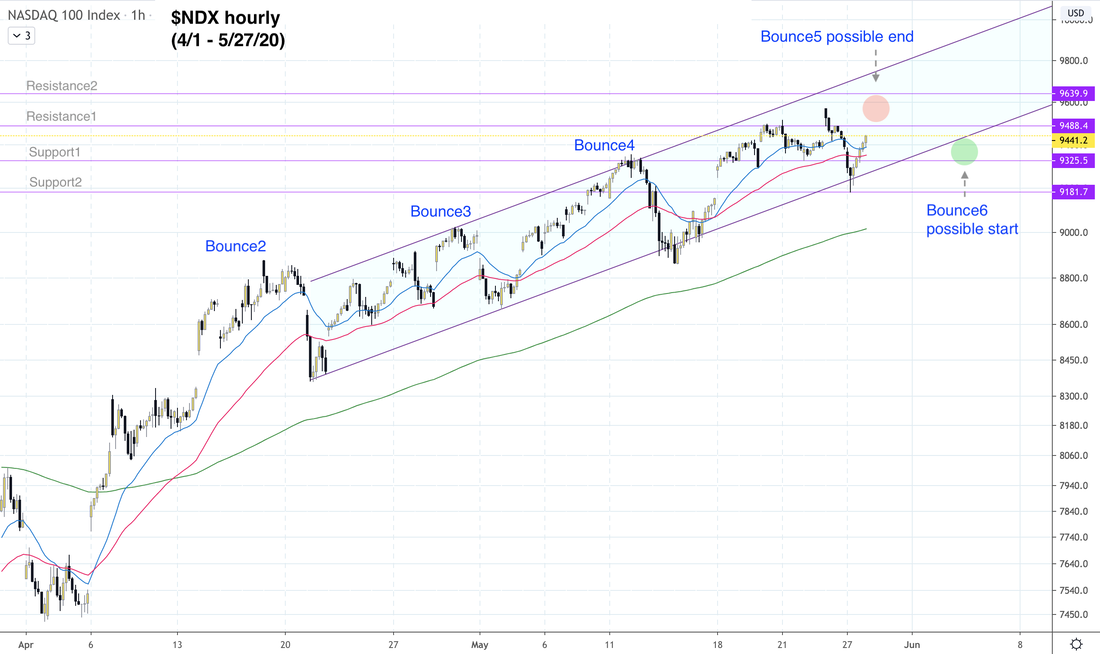 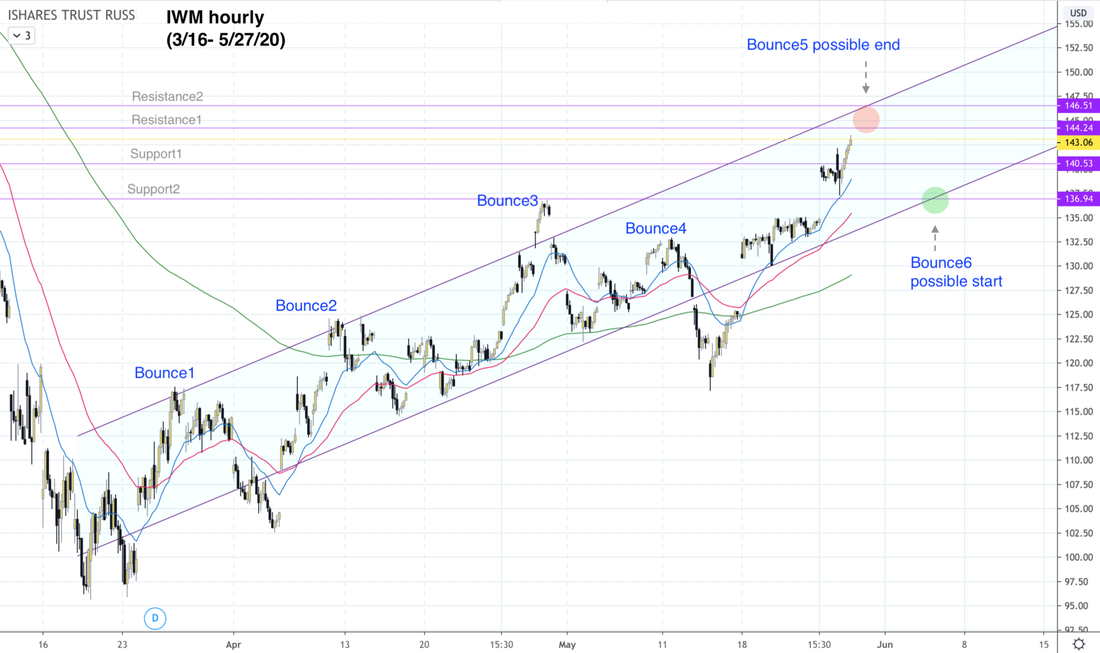 We provide nightly analysis along with signal updates for all time frames for $SPX $NDX SPY QQQ IWM TNA TZA. Members also get access to our timely intraday updates and in-depth weekend analysis. SUBSCRIBE now and take advantage of our introductory low rate of just $39/month. You can cancel at any time. The stock market at this point has officially social distanced itself from the economy. They are not just 6 feet apart. They are 6 million miles apart. With the help of the Fed, the stock and bond markets have become a game of "greater fools". We are encouraged to jump in and buy high, because there will be a greater fool who will buy higher from us. And while we are at it, let's drink some Kool-Aid too. Here's a prime example of the "greater fools" scenario currently happening. From Wall Street Journal: “For much of the past month and a half, the yield on the benchmark 10-year U.S. Treasury note has hovered around two-thirds of a percentage point—a shade above its all-time low of around 0.5% set in March. Taken together, the low level of the 10-year yield and its stability suggest that bond investors not only hold a dreary economic outlook but also are unusually confident in that perspective, a contrast with the optimism that has carried stocks to their highest levels since early March.” So big institutional investors are persistently bearish. Meanwhile: "Last week, the smallest of options traders (those who trade 10 contracts or fewer at a time) positioned themselves to bet on a rally, buying bullish calls and selling bearish puts at a record pace." Only one of these two groups will be right. And only time will tell. But past history heavily favors big money. It would be truly wise for us "dumb money" to realize that we are just that: the dumb money that functions as the greater fools for the big money. You are probably thinking "What a depressing thought!". True. But there is no one forcing us to be the dumb money. There's only us making those decisions ourselves. As long as we are aware that we may be stepping into traps, we may have a chance of navigating around them successfully. Our personal theory about big money is this. Don't bet against them. Instead, follow their crumbs! How do we find their crumbs? In technical analysis. Big money cannot move big amount of money without leaving a trail. They are the market after all. One very important component of technical analysis is to understand the time frame of your data and projections. Low-risk high-reward (LRHR) setups exist for each time frame, but they don't cross time frames necessarily. For example, you can be bullish short term, and neutral to bearish medium term. We encourage you to read all of our analysis in all time frames. But your job is to decide which time frame you are trading in, and don't mix up our projections from one time frame with the other. Medium-term As we explained last week, medium term trade is the a trade that may last multiple weeks. For example, capturing the entire Dive1 is a medium-term trade. It lasted from 2/20 to 3/23. Or capturing all of the bear market rally is another medium-term trade. Right now the ideal medium term trade is to finish riding the bear market rally with a long position. However, this trade would only make sense for medium term if it was entered closer to 3/23. Entering long right now does not meet LRHR criteria for medium term. Here's why. SUBSCRIBE to read our full analysis and get our signal updates for $SPX $NDX SPY QQQ TQQQ IWM TNA TZA. Take advantage of our introductory low rate of just $39/month. You can cancel at any time.
Below is an excerpt of our weekend analysis posted Sunday 5/3/20. Invest: Long Term Portfolio Starting in early February, we wrote that you might want to sell high and use asset allocation strategy to rebalance the portfolio and reduce stock exposure in long-term portfolios. We ourselves got out of all stocks in our long-term portfolio in February. Since the Down Trend started on 2/20, we recommended to stay in cash for now because the current Down Trend is not over yet. Apparently, Warren Buffet agreed with us. He revealed the following information in Berkshire annual meeting on Saturday 5/2.
So if the famous long-term investor Warren Buffett isn’t buying right now, we certainly are not deploying long-term money into the stock market just yet. If we were still holding stocks in a long-term portfolio, we would try to sell weaker stocks, just like Buffett did, to take advantage of the current higher price, before Dive2 takes off for real. SUBSCRIBE to read our full analysis and get short-term signal updates for $SPX $NDX $RUT SPY QQQ TQQQ. Take advantage of our introductory low rate of just $39/month. You can cancel at any time.
|
Archives
July 2024
Categories |
 RSS Feed
|
|
Copyright (c) 2019-2024 LOOK Systems LLC
All rights reserved. |