|
We trade 3x ETFs such as TQQQ TNA SOXL LABU using proprietary analysis of volatility. For actual trades, click here. Trading SOXL in June 2021 We want to share with you what we share with our members live every day. We traded SOXL in June for a gain of almost 12% over 2 weeks. We want to share with you our thinking process, which hopefully will be food for thought for your next trade. Below is SOXL chart showing our entry signal for entering SOXL in June 2021. We also showed our exit signal when we collected profit. 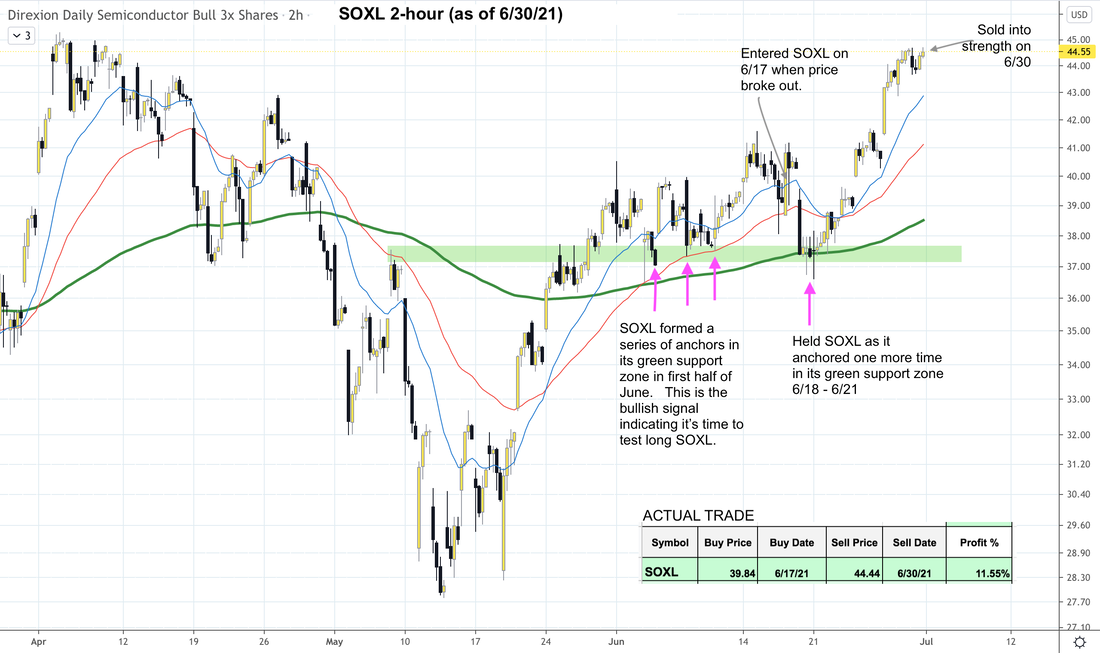 Lessons Learned
Click here for Signal Trade Spreadsheet. Subscribe now at our introductory low rate of only $39 per month!
0 Comments
We trade 3x ETFs such as TQQQ TNA SOXL LABU using proprietary analysis of volatility. Our 12-month trading record: 260%. For actual trades, click here. Unwinding the reflation trade Since the start of this year, investors and traders have been betting on the reflation trades. These are bets that the Fed will let inflation stay high without slowing bond purchase or raise rates for quite a while. But the Fed's announcement on 6/16 changed that equation. Not only did the Fed signaled that they are looking at raising rate in 2023, and starting to discuss tapering bond buying, they also indicated that they will move to address the effects of inflation on consumer and business behavior, rather than tolerating it for a while. So immediately after the announcement, $SPX IWM began to sell off while $NDX climbed higher. There is a high probability that this rotation will continue a while longer yet, until $NDX becomes overbought again. Investors and traders are now betting that the Fed will act more quickly against inflation, which will lead to slower growth and lower interest rates in the long term. This is most evident in the fact that yields from shorter dated Treasury bonds (IEF, US10Y) have risen, while yields on 20+ years Treasury bonds (TLT, US30Y) have dropped. You may read about the flattening of the yield curve. This is what it's about. This flattening is seen as bad for bank stocks. Big Picture From a really big picture perspective, there is no indication that market participants are worried about a recession or an overheated economy. Not too hot. Not too cold. We may actually be looking at Goldilock condition for the economy (where the porridge is just right). So there is no crash signal on the horizon. That doesn't mean we won't see a major pullback at some point for $SPX $NDX IWM. But not right this moment. ... Read the rest of this analysis, and get the latest entry/exit signals for SPY QQQ TQQQ IWM SPX NDX based on VIX here. We trade 3x ETFs such as TQQQ TNA SOXL LABU using proprietary analysis of volatility. For actual trades, click here. Updates 1:15 AM EST- Monday 6/21/21 The week ahead There was much excitement last week with the big FOMC announcement on Wednesday 6/16 and quad witching on Friday 6/18. This week won't be quite as big, but there are a number of important economics reports being released. Attention will continue to focus on the key topics: inflation, yields and the US dollar. While the stock market had a knee-jerk reaction to FOMC announcement, the bond market gave a very clear signal on Thursday and Friday. Bond traders were not selling. Instead, they were buying 10-year and 30-year Treasurys (IEF, TLT), sending 10-year and 30-year yields down sharply, not up. If you look at TradingView US10Y AND US30Y weekly charts, you will see that they have been down since 3/15. And they are dropping right now as we write this. This tells us that bond traders are not that worried about inflation, or an overheated economy. Us stock traders should take our cue from that, instead of the fretting headlines. However, we cannot trade based on macro economic conditions alone. Good old $VIX $VXN $RVX charts tell us that there may be a few days of volatility and selling still. But then conditions will likely turn bullish for $SPX $NDX IWM to resume their climbs. Finally, we want to mention a couple observations about the US dollar. It is definitely climbing as an asset, bolstered by the fact that the US economy is probably stronger than many others right now. But what impact does the rising dollar have on Treasury yield? Well, it's an interesting circle of effects. According to WSJ in early June: The cheapest dollars in years are spurring a rise in foreign investment in U.S. government bonds at the same time that pension funds are boosting their holdings—and that demand pickup could weigh on Treasury rates even as the economy strengthens.... According to WSJ last week: Higher interest rates in the U.S. make investing in American bonds more attractive to foreigners, and can increase demand for the dollar from overseas. Treasury yields rallied their most in three months after the Fed’s disclosures Wednesday, helping bolster appetite for the dollar. So there you have it. The demand for Treasury bonds is unlikely to drop because even though the dollar is rising, rates are expected to rise and will stimulate demand. ... Read the rest of this analysis, and get the latest entry/exit signals for SPY QQQ TQQQ IWM SPX NDX based on VIX here. We trade 3x ETFs such as TQQQ TNA SOXL LABU using proprietary analysis of volatility. For actual trades, click here.
Updates 1:00 AM EST- Wednesday 6/16/21 FOMC announcement may trigger sell-off It's hard to predict what the Fed will say, but the last three FOMC announcements (1/27, 3/17, and 4/28) have been followed by substantial multi-day sell-off for $SPX $NDX IWM. So we think it is prudent to go flat ahead of the Fed. $USD building a base to rise We discussed in Monday post about the impact of US dollars on bond prices, where cheap dollars have been spurring the demands for Treasury bonds by foreign buyers. Rising demands for Treasurys means lower yields, and that's favorable for growth stocks. At this point however, it seems that the US dollar is building a W bottom to rise in the short term. (See UUP DXY charts.) Correspondingly, 30-year and 10-year Treasury bonds (TLT, IEF) are forming short-term tops, and 10-year US yield is steadily marching up, pivoting from the recent low of 1.43. It is currently almost 1.5. This is not favorable for growth stocks such as $NDX. US dollar movement does not correspond tick by tick with $SPX $NDX IWM market movement. But it is important to understand and monitor the macroeconomic perspective, because it is the underlying force. We trade 3x ETFs such as TQQQ TNA SOXL LABU using proprietary analysis of volatility. For actual trades, click here. Updates 11:15 PM EST- Monday (for Tuesday 6/15/21) All eyes on the Fed FOMC June meeting starts on Tuesday, culminating in the announcement at 2 PM EST on Wednesday. According to WSJ: Federal Reserve officials could signal this week that they anticipate raising interest rates sooner than previously expected following a spate of high inflation readings. At the end of the March meeting, the Fed dot-plot showed that most Fed officials expected to keep the Fed's benchmark interest rate near zero through 2023. However, the CPI has jumped from 2.4% in March, to 4.2% in April, and 5% in May. Therefore, there are now more speculations that the June dot-plot will show more officials expecting to raise rates in 2022 or 2023. Additionally, WSJ speculated that the Fed will begin discussing tapering their bond purchase program (Treasury and mortgage bonds). There are many hedge fund managers and bankers who firmly believe that inflation is here to stay. Only time will tell, but for the very short-term, we wouldn't bet against the Fed yet. It's one thing to lock in profits, but we are not planning to bet on a serious pullback just yet. ... Read the rest of this analysis, and get the latest entry/exit signals for SPY QQQ TQQQ IWM SPX NDX based on VIX here. We trade 3x ETFs such as TQQQ TNA SOXL LABU using proprietary analysis of volatility. For actual trades, click here. Updates 1:00 AM EST- Monday 6/14/21 Bullish big picture In the big picture context, this is a calm and bullish market that is climbing a wall of worry. There are two big clues for this projection. The first set of clues come from market internals, which have turned bullish for Nasdaq stocks, and continue to stay bullish for NYSE.
The second set of clues come from $VIX $VXN $RVX charts. They are all sending out the same message. They are likely to head lower, and this is bullish for $SPX $NDX IWM. See charts below. However, there will be some excitement this week with FOMC announcement on Wednesday 6/16, and quadruple witching day on Friday 6/18. Here is the economic calendar for this week. Rate, yield, and $USD Despite the scary CPI numbers last Thursday, and the hand wringing by economists about runaway inflation, investors have not panicked and dumped bonds. In fact, they are piling into Treasury, mostly because of the weak US dollars. According to WSJ: The cheapest dollars in years are spurring a rise in foreign investment in U.S. government bonds at the same time that pension funds are boosting their holdings—and that demand pickup could weigh on Treasury rates even as the economy strengthens....Recent Treasury bond auctions have seen an uptick in demand from foreign investors. This is happening because 10-year US Treasury is still yielding higher than Europe or Japan equivalent bond. Another source of money flowing into Treasurys has been pension funds. Strong rallies in riskier assets, like stocks, in recent months helped to close the shortfall many funds have between the value of their assets and their liabilities, allowing them to move cash into safer assets, like bonds. U.S. pension funds shifted nearly $90 billion of funds out of stocks and into fixed income during the first quarter of this year, $41 billion of which went into Treasurys, according to analysts at Bank of America. We need to monitor what's happening with US 10-year yield because its rise and fall can have a lot of impact on the stock market, especially on growth stocks like $NDX. The surge in yield back in January was due in part to Japanese banks selling US Treasury bonds. New traders don't always pay attention to yields, rates, US dollars and the bond market. But as you have seen, their movements can have a lot of impact on stocks. In fact we would surmise that the current Big Bull up swing will continue until US 10-year yield drops down to about 1.2. (It is currently at 1.462.) Then we may see yield creeps back up again. ... Read the rest of this analysis, and get the latest entry/exit signals for SPY QQQ TQQQ IWM SPX NDX based on VIX here. Entry/exit signals for SPY QQQ TQQQ IWM SPX NDX based on VIX. Click here for latest Signal Trades. Updates 2:22 PM EST- Wednesday 6/2/21 Volatility climbing up and breadth dropping Both NYSE and Nasdaq A/D issues are hovering around zero, and are trending towards negative breath possibly in the next few days. In short, expect more selling. $VIX $VXN $RVX are coiling to rise up some more. Both of these are bearish warnings of possibly more selling for $SPX $NDX IWM. So Big Bull up swing may be approaching the end. We decided to lock in profit for SOXL and waiting to exit TQQQ. ... Read the rest of this analysis, and get the latest entry/exit signals for SPY QQQ TQQQ IWM SPX NDX based on VIX here. |
Archives
July 2024
Categories |
 RSS Feed
|
|
Copyright (c) 2019-2024 LOOK Systems LLC
All rights reserved. |