Updates 4 PM ET - Friday 12/23/22 Today's exit from bear position (TZA)  Updates 1:33 PM ET - Friday 12/23/22 $VIX and market breadth suggest a rally may be in the making $VIX tried to rise this morning but did not succeed. It may be still building a base for rising, but so far it has very little momentum. We have to allow for the possibility that $VIX is building a base for possibly dropping a lot more. This would mean another bear market rally is in the making. Market breadth charts support this possibility. ES NQ RTY price actions also support this possibility. So we have tightened the stop on our TZA positions. We are not entering TNA or any bullish position yet. The next key reversal point will likely come after the job report on January 6. Have a wonderful holiday. Updates 1:00 AM ET - Friday 12/23/22 Key S/R levels The relief bounce was sharp but short. Below are the new key S/R levels. 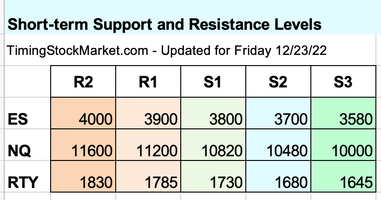 Right now price actions, volatility and market breadth tell us that conditions are bearish. We need to continue monitoring the key charts for clues. Are the bearish conditions continuing, or are ES NQ RTY setting up for another bear market rally? In RTY 4-hour chart below, we discussed the bearish versus bullish EMA patterns that we are looking for. We are leaning bearish at the moment. Note that Personal Income & Spending report at 8:30 AM may move market direction given the thin holiday trading. 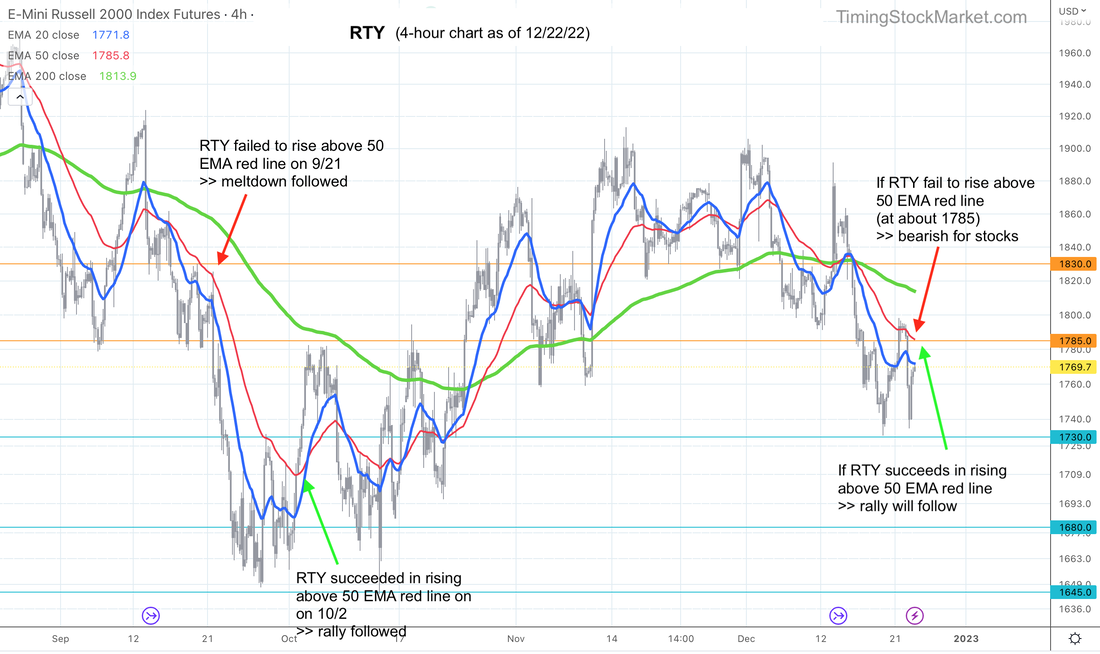 Market breadth: bearish; Volatility: bearish Market breadth charts have gone back to being quite bearish. $VIX chart is finally forming the W bottom pattern that we've been waiting for. To ensure that this W pattern continues to develop, we want to see $VIX 20-hour EMA blue line surges above its 200-hour EMA green line. This green line currently is close to 22.8 which is a crucial $VIX level. If the W pattern stays intact and $VIX 20-hour EMA blue line surges up, that's a very bearish setup for stocks. On the other hand, we may see $VIX 20-hour EMA blue line rises just a bit above its 200-hour EMA green line, then drops back below it. That's actually a highly bullish setup for stocks to reverse into a bear market rally. 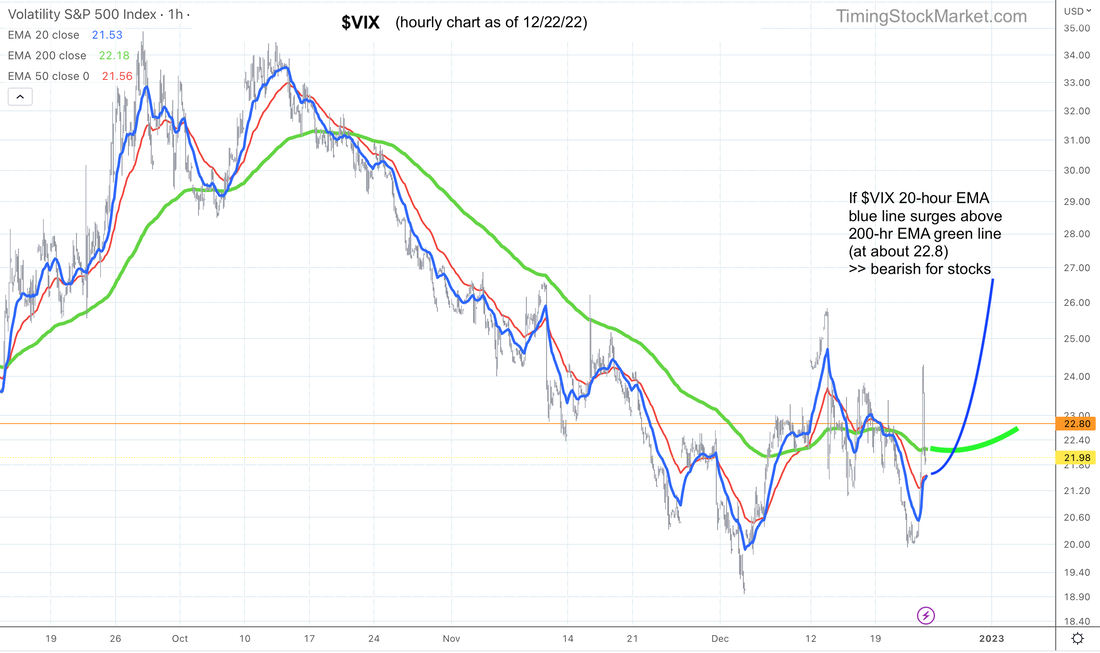 Our Personal Trade Plan
Subscribe to get our latest analysis, daily trade plans and live intraday trades. Current trade record here. Disclaimer The information presented here is our own personal opinion. Consider it as food for thought. We are not offering financial advice. We are not promoting any financial products. We are not registered financial advisers or licensed brokers. We make no guarantee that anything will unfold according to our projections. You are proceeding at your own risk if you follow our trades. Disclaimer The information presented here is our own personal opinion. Consider it as food for thought. We are not offering financial advice. We are not promoting any financial products. We are not registered financial advisers or licensed brokers. We make no guarantee that anything will unfold according to our projections. You are proceeding at your own risk if you follow our trades.
0 Comments
Updates 4 PM ET - Tuesday 12/13/22 Today's bearish entry into TZA 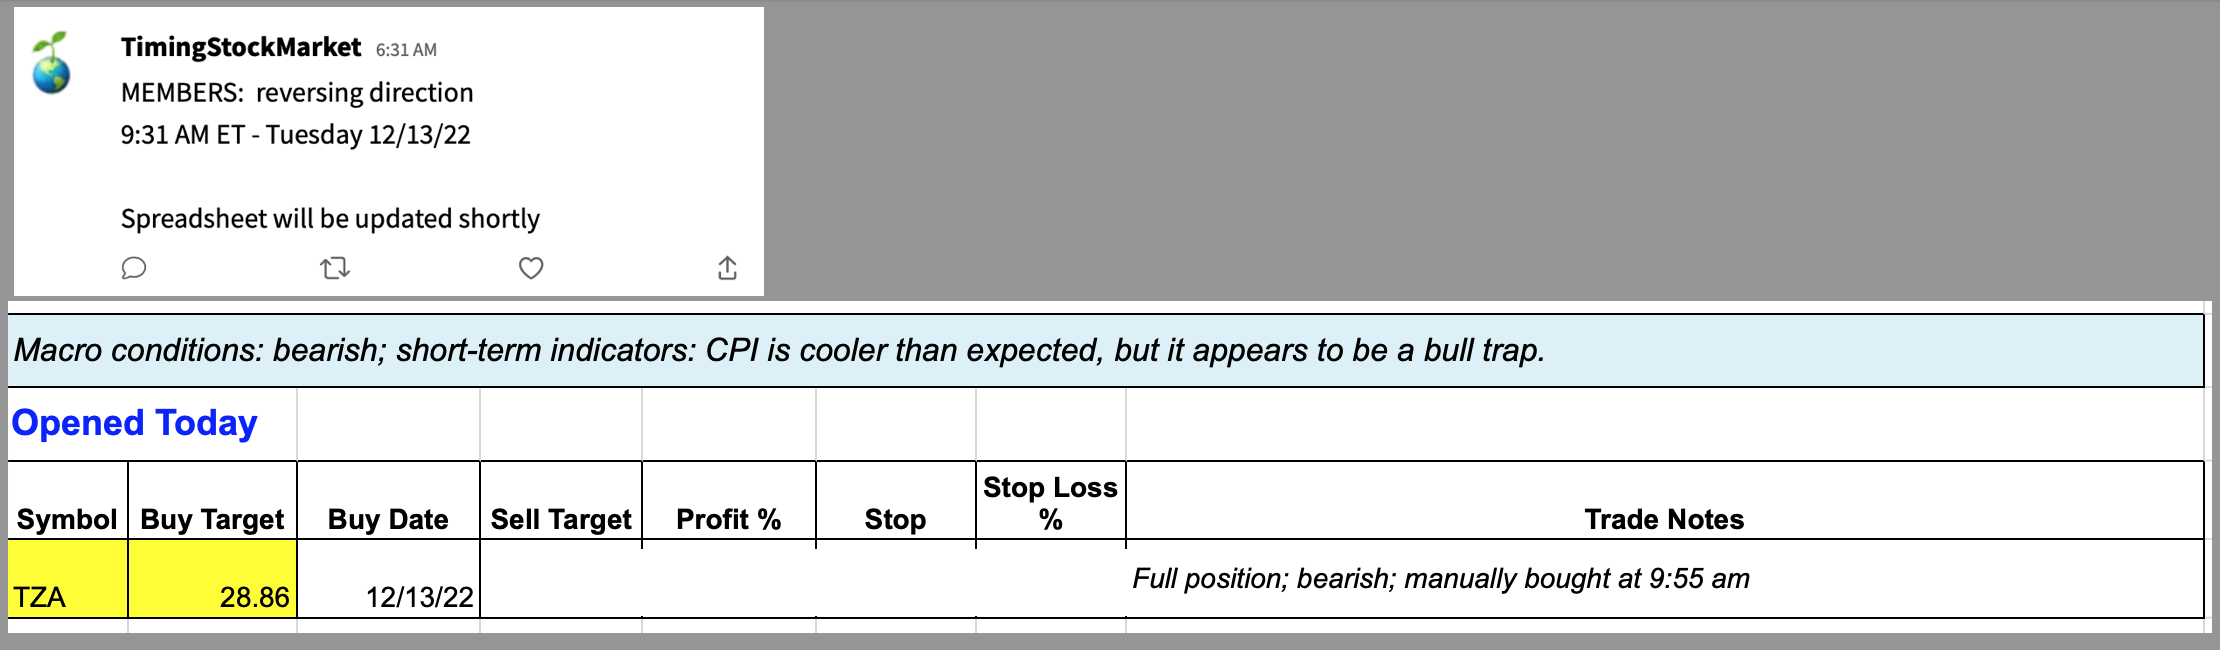 Updates 3:06 PM ET - Tuesday 12/13/22 It was a bull trap as anticipated $VIX chart was very difficult to track today as it swung all over the place pre-market. But SVXY chart gave us a pretty good clue where volatility is heading. SVXY 30-min chart below shows SVXY forming double top pattern above its 200 EMA green line. This pattern is usually followed by multiple weeks of rising $VIX. So we entered TZA this morning, after a quick small test of TQQQ. TZA took off nicely as ES NQ RTY all dropped sharply. But don't expect them to keep dropping just yet. The odds are high that there will be some thrashing price actions while ES NQ RTY form a top. We are holding on to our TZA position and have not tightened stop just yet. We plan to add another TZA position after FOMC tomorrow if this bearish pattern plays out. 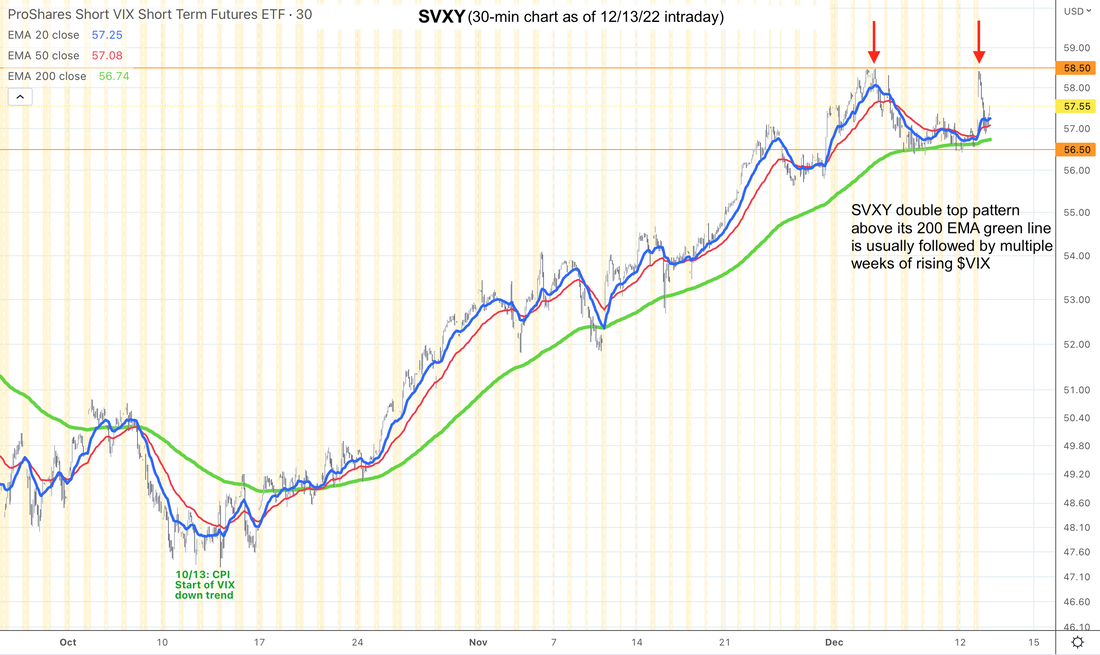 Updates 8:57 AM ET - Tuesday 12/13/22 Maybe bull trap Consumer prices rose less than expected. ES NQ RTY have shot up, but $VIX and UVXY charts are sending out warnings that this may be a bull trap. Our buy target right now is actually SQQQ. Monitoring to scale into when it forms a bit more of a base. Updates 12 AM ET - Tuesday 12/13/22 Key S/R levels The S/R levels have been revised in the table below. 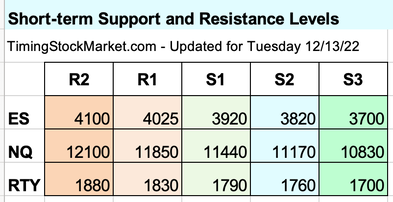 Post CPI scenarios to consider 1. Very cool CPI: Highly bullish. ES NQ RTY will surge sharply right away, while $VIX will drop. ES NQ RTY may end up above R2, with ES possibly up near 4300 eventually. In this scenario, we'd enter TQQQ immediately. 2. Very hot CPI: Highly bearish. ES NQ RTY will drop sharply right away, while $VIX will surge. ES NQ RTY may end up as low as S3 eventually. In this scenario, we'd enter TZA immediately. 3. Barely budging CPI: Very tough scenario to discern in advance. We think that the following $VIX path may take place in this scenario. (See chart below.)
 Subscribe to get our latest analysis, daily trade plans and live intraday trades. Current trade record here. Disclaimer The information presented here is our own personal opinion. Consider it as food for thought. We are not offering financial advice. We are not promoting any financial products. We are not registered financial advisers or licensed brokers. We make no guarantee that anything will unfold according to our projections. You are proceeding at your own risk if you follow our trades. |
Archives
July 2024
Categories |
 RSS Feed
|
|
Copyright (c) 2019-2024 LOOK Systems LLC
All rights reserved. |