|
Click here for our Signal Trades. Below is a time-delayed excerpt from our live updates for members. Updates 2:00 PM EST - Friday 9/25/20 Friday's trade results and positioning for Monday The current market condition is: bearish headwinds for $SPX $NDX IWM still in effect. But the headwinds have eased up today. $SPX $NDX IWM have bounced as a result. In the Signal Trades we went long today with TQQQ and TNA. This was based on our assessment pre-market at 9:05 AM. We tightened the sell limit prices for both positions ahead of the weekend. TNA has already gotten stopped out for a small gain. We are waiting to collect our profit with TQQQ. We don't want to hold positions long or short over the weekend. This is a very choppy market. $SPX $NDX IWM are oversold and are attempting to bounce. But the bounce won't be a smooth and easy ride. And it may be a short bounce. Therefore the reward:risk ratio is not favorable for holding on to positions over the weekend. $VIX $VXN are both approaching the zones where they are expected to anchor. They may start anchoring later today, but $VIX $VXN are unlikely to pivot and rise substantially today. They most likely will resume their rise early next week, but the timing for it is unclear right now. We have temporarily removed our UVXY buy limit order. We will analyze the data more for the weekend analysis. Updates 9:05 AM EST - Friday 9/25/20 Pre-market The current market condition is: bearish headwinds for $SPX $NDX IWM, but the headwinds are easing up today. Futures ES NQ RTY stabilized last night. They did not drop below 9/24 lows. This is likely to set up an attempt for futures as well as $SPX $NDX IWM to climb higher today, at least back to the highs of 9/24. $VIX $VXN will most likely spend the day grinding downward to anchor at their 200-hour EMA lines.
Given that today is Friday, if you plan to trade bullish positions, you may want to consider booking your profits when $VIX $VXN get down into these zones. $VIX $VXN are likely to pivot upward once they have anchored themselves one more time. When $VIX $VXN resume their rise, $SPX $NDX IWM will resume their drops. Updates 11:40 PM EST - Thursday (for Friday 9/25/20) SUBSCRIBE now to read the rest of this post, including full analysis and projections for $SPX $NDX IWM. Get complete access to our intraday live Signal Trades. Take advantage of our introductory low rate of just $39/month. You can cancel anytime.
Click here for our Signal Trades.
0 Comments
Click here for our Signal Trades. Below is a time-delayed excerpt from our live updates for members. Updates 12:30 AM EST - Wednesday 9/23/20 $VXN
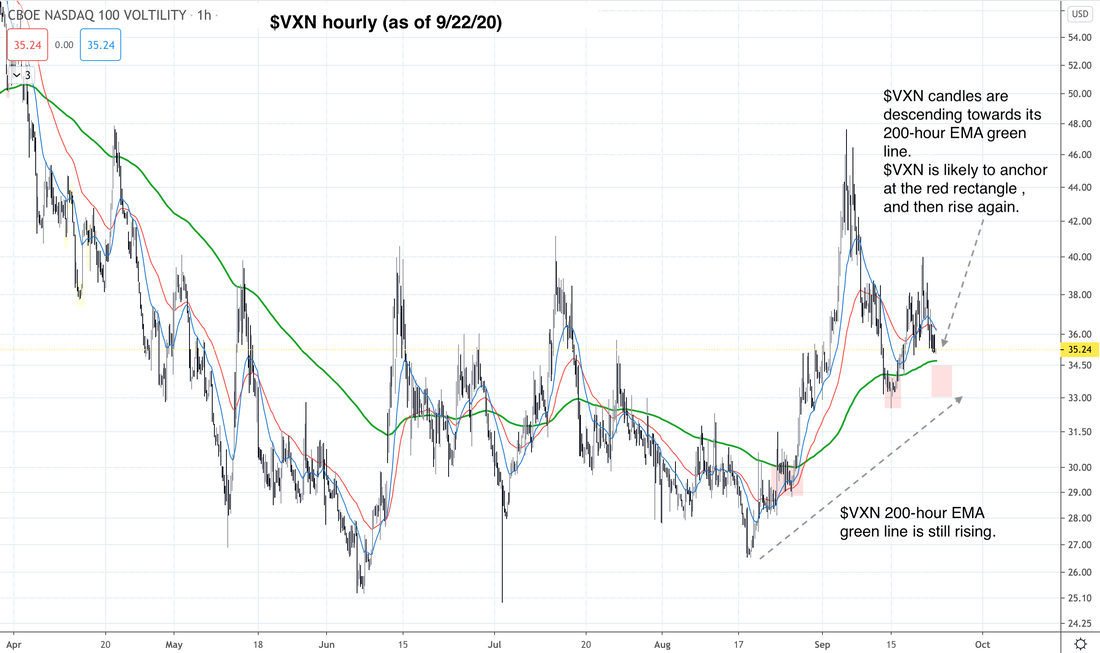
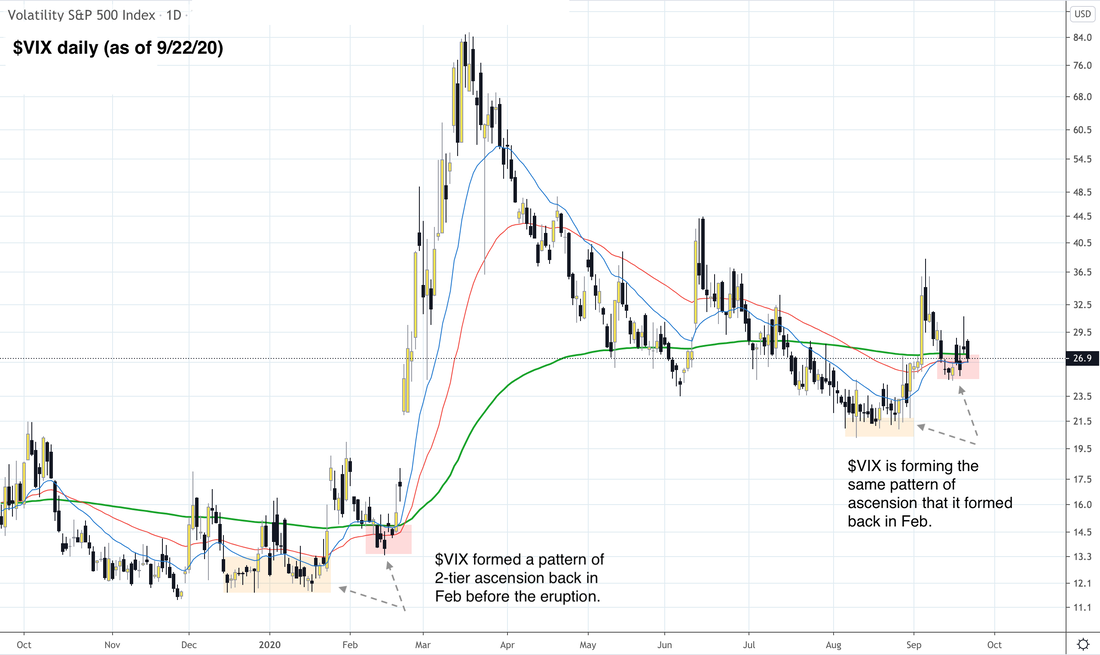
This means that the bearish headwinds for $NDX eased up a bit today. This enabled $NDX to rise some amount. However, as shown in its hourly chart below, $VXN is likely to anchor at the red rectangle near its 200-hour EMA. If $VXN does, this is an anchor-to-rise pattern. When $VXN resumes its rise, it means the bearish headwinds are accelerating, and $NDX will likely drop sharply. $VIX $VIX is forming the same pattern of ascension that it formed back in Feb, as shown on its daily chart below. Despite spending the last 7 sessions futzing around, $VIX has shown that it is clearly anchored in its red zone. If it continues staying at this level, $VIX is capable of breaking out. Again, this would be very strong bearish headwinds for $SPX IWM. Table of Support & Resistance Zones We've updated the orange resistance zones and the green support zones to reflect the short swings within the down channels. Click here for our Signal Trades. SUBSCRIBE now to read the rest of this post, including full analysis and projections for $SPX $NDX IWM. Get complete access to our intraday live Signal Trades. Take advantage of our introductory low rate of just $39/month. You can cancel anytime. Click here for our Signal Trades. Below is a time-delayed excerpt from our live updates for members. Updates 2:25 PM EST - Thursday 9/3/20 Short Term We took partial profits with UVXY Position1 in our Signal Trades and raised the sell limit order for UVXY Position2. The bet on volatility strategy that we wrote about since Wednesday has paid off nicely so far. We also lowered the buy limit orders for TQQQ (2 positions). Why?
There's a fair amount of profit taking happening for $SPX $NDX. And there's a sense of mild panic in the air from the novice traders not used to a sudden steep market drop. Selling begets selling. When the market surges on a couple of key stocks such as AAPL and TSLA, it will dive on a couple of key stocks such as AAPL and TSLA too. So we might as well try to take advantage of the situation and buy low. In the Signal Trades spreadsheet:
Updates 10:21 AM EST - Thursday 9/3/20 Short Term $SPX $NDX IWM are trying to find support from the morning gap down. First level of support for $SPX $NDX IWM is the zone around the high of August 27. If $SPX $NDX IWM bounce from this level, their first level of resistance is this morning's high. If $SPX $NDX IWM fail to bounce from here, they may be on their way to drop sharply down to their green support zones. This most likely won't happen today, but the mood has changed in the short term from super bullish to profit taking mode. This is the down swing in the channel that we were talking about. In the Signal Trades spreadsheet:
Updates 9:17 AM EST - Thursday 9/3/20 Pre-market
There is a chance that in the morning fluctuation, $VIX will drop a bit and therefore UVXY will drop a bit too. If you are looking to enter UVXY or add to your positions, see our Signal Trades setup. You will need to monitor $VIX $VXN UVXY closely. The opportunity may be fleeting. In the Signal Trades spreadsheet:
Updates 12:59 AM EST - Thursday 9/3/20 Members get full access to in-depth nightly analysis. SUBSCRIBE now to read the rest of this post and gain full access to all our analysis and live signals. Take advantage of our introductory low rate of just $39/month. You can cancel anytime. Click here for our Signal Trades. See FAQ for more explanations on terms, labels and abbreviations that we use. Below is a time-delayed excerpt from our live updates for members. Updates 12:59 PM EST - Wednesday 9/2/20 Short Term What a morning! Full of whipsaw and head fake. You are on a roller coaster ride whether you are long or short $NDX QQQ TQQQ. The fact that $SPX $NDX are detached from market internals and the volatility indices makes it very hard to gauge whether $SPX $NDX are done with the current up swing within their channels, or whether there's still room to go higher. In general, letting FOMO decide our trades usually leads to poor results. No one says we have to trade every move in the market. Meanwhile $VIX $VXN UVXY keep grinding upward. So we are going to stick with UVXY for now and wait for $NDX to drop lower in its channel before entering long. Please note that the up channels for $SPX $NDX IWM are all still intact from a big picture perspective. We are simply waiting for $NDX to drop lower inside its channel to give us a better short-term entry price. See our Signal Trades for the trade setups. Updates 9:15 AM EST - Wednesday 9/2/20 Pre-market $VIX dropped a small amount, but is forming a pattern pre-market indicating it is ready to rise higher than 26.5. Meanwhile $SPX $NDX are going to gap up big, and most likely will drop some amount. They are not necessarily done with their up swings within the their channels just yet. In other words, after some morning pullback, they may rise up sharply again. See our Signal Trades for entries so far. Keep in mind we are now entering an environment where $SPX $NDX IWM can rise while $VIX $VXN UVXY can rise too. See our detail explanations from last night. This is a tough environment to trade. So please trade small, take profit frequently, don't get married to your positions, and certainly don't bet on what you think the market should do or should not do. Let the signals guide your trades. Updates 12:55 AM EST - Wednesday 9/2/20 $VIX $VXN $VVIX $SPX $NDX IWM are rising sharply, but they are rising against a backdrop of persistently rising volatility. We have been sharing this bearish divergence with you since mid August, as shown by $VIX $VXN and $VVIX daily charts below. For those of you who may not be familiar with these indices, they are:
We couldn't give you the reasons why $VIX $VXN have all been rising for multiple weeks now. But our trading system has been designed to monitor volatility closely. It picked up these patterns pretty quickly. And now we have more explanations behind this persistent rise in volatility. Apparently very strong demand for call options on the biggest tech names has spurred derivative dealers to bid up both stocks and their implied volatility indexes. This is because dealers need to hedge their long positions using bets on volatility. This can cause the actual stocks and their implied volatility to rise together. Dealers are also using $VIX $VXN for additional hedging. Now when these very popular stocks start to drop, dealers may unwind their hedges at very fast speed. This unwinding can add fuel to the drop in price and the sharp rise in volatility. Please read this article and this for more details. Here is how we interpret this information. Whether stocks continue to rise, or start to fall, a bet on rising volatility actually seems like a low-risk strategy.
So in theory, we should see $VIX $VXN UVXY continuing to rise. But we have to track the charts closely for actual confirmations before placing the trades. Members get full access to in-depth nightly analysis. SUBSCRIBE now to read the rest of this post and gain full access to all our analysis and live signals. Take advantage of our introductory low rate of just $39/month. You can cancel anytime. |
Archives
July 2024
Categories |


 RSS Feed