|
Entry/exit signals for SPY QQQ TQQQ IWM SPX NDX based on VIX.
Click here for latest Signal Trades. Updates 8:28 PM EST- Sunday (for Monday 5/24/21) Perspective According to WSJ: Several Federal Reserve officials said Friday that the day is approaching when the central bank will dial back the stimulus it is providing the U.S. economy, but they didn’t say when. The Fed is clearly warming up the investor mindsets to transition to a tighter monetary policy. It won't be "if". It will be "when". This key decision will continue to loom over the economy, and will be watched closely at the upcoming FOMC announcement on 6/16. More Fed speakers are scheduled for this coming week. Some closely watched economics reports will be: Tue: Case-Shiller Home Price Index, New Home Sales Thu: Durable Goods Orders, GDP, Jobless Claims Fri: Personal Income & Outlays Friday's report is quite important as it is the Fed's preferred inflation gauge. Friday may be a volatile day for all assets as all markets are closed on Monday 5/31 for Memorial Day. While the Fed waits for their official data, most consumers will say it feels like rampant inflation is already here, in the price of houses, cars, food, and basic commodities. Don't forget the staggering costs of higher education and healthcare. However, we've been observing that the following traditional inflation havens appear to have formed tops and have been dropping in the last couple weeks:
Real gold (GLD) is still standing, while digital gold (BTC, ETH, DOGE) is heading to the abyss instead of the moon. The most interesting charts though are those of Treasury bonds (TLT, IEF). They have been anchoring at support for the last several weeks, and appear to be ready to rise. This means important yields like US 10-year are likely to drop. To us, this means that investors are not as concerned about long-term inflation as the headlines would have us believed. In the short term, it may mean that the rotation into commodities and value stocks that started in late 2020 are fading. Instead we may start to see the rotation back into technology. Confirmations of this thesis are on the charts of TSLA and ARKK, the bellwether of tech risk takers. They both formed nice bullish hammers at key support levels on their weekly charts. ... Read the rest of this analysis, and get the latest entry/exit signals for SPY QQQ TQQQ IWM SPX NDX based on VIX here.
0 Comments
Click here for latest Signal Trades. Updates 2:30 AM EST- Tuesday 5/18/21 Table of Support & Resistance Zones IWM and TNA orange resistance zone have been updated in the S/R table below. Everything else is the same. The green support zone is where this current major pullback may end. The orange resistance zone is short-term strong resistance level. 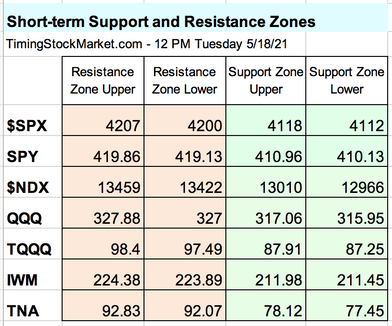 $VXN 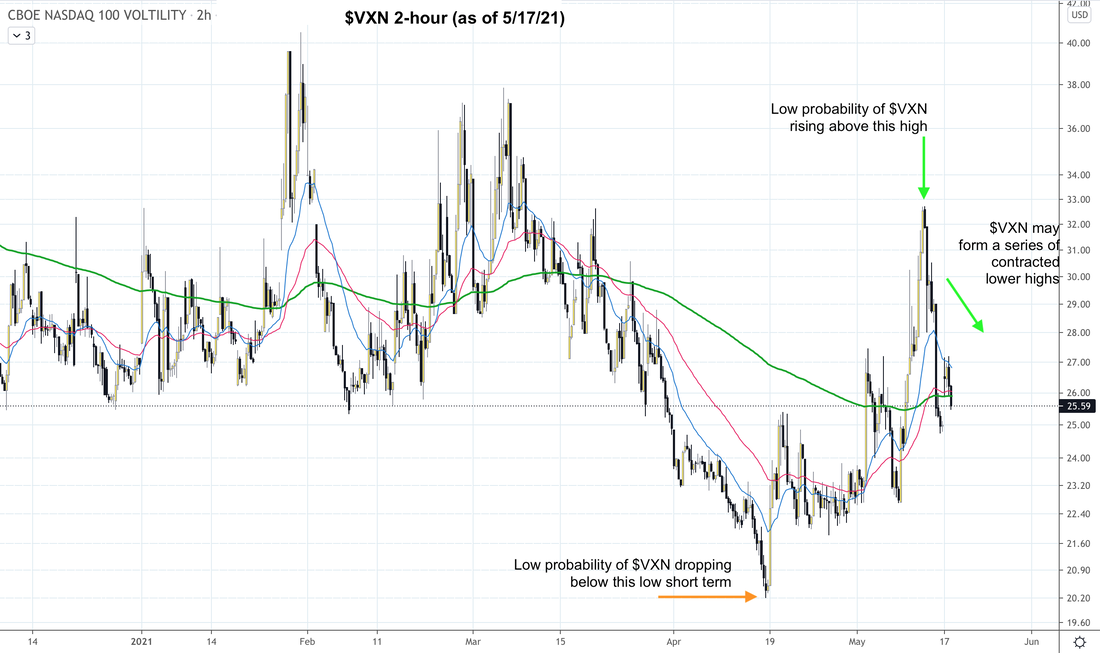 $NDX In yesterday's post, we discussed the scenario where $NDX may quickly drop down to anchor in its green support zone, in order to bring in new buyers to really rise up. However, we should also consider the sideway range scenario discussed below. If $VXN is going to contract and form a gradual series of lower highs, $NDX is very likely going to contract into a range while forming a gradual series of higher lows. 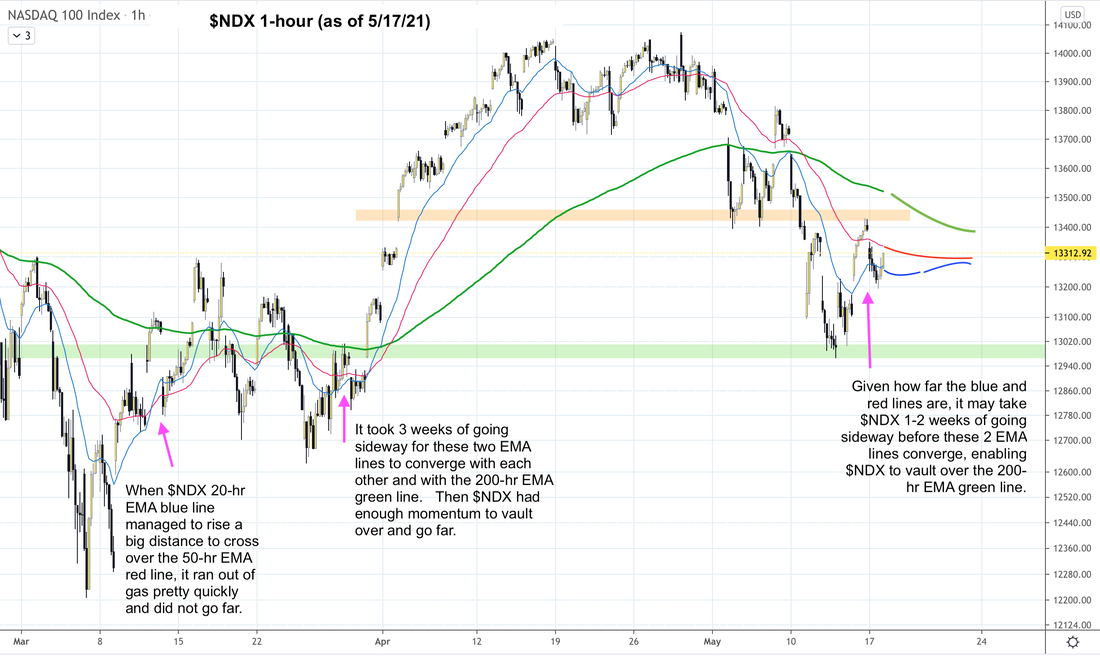 $VIX 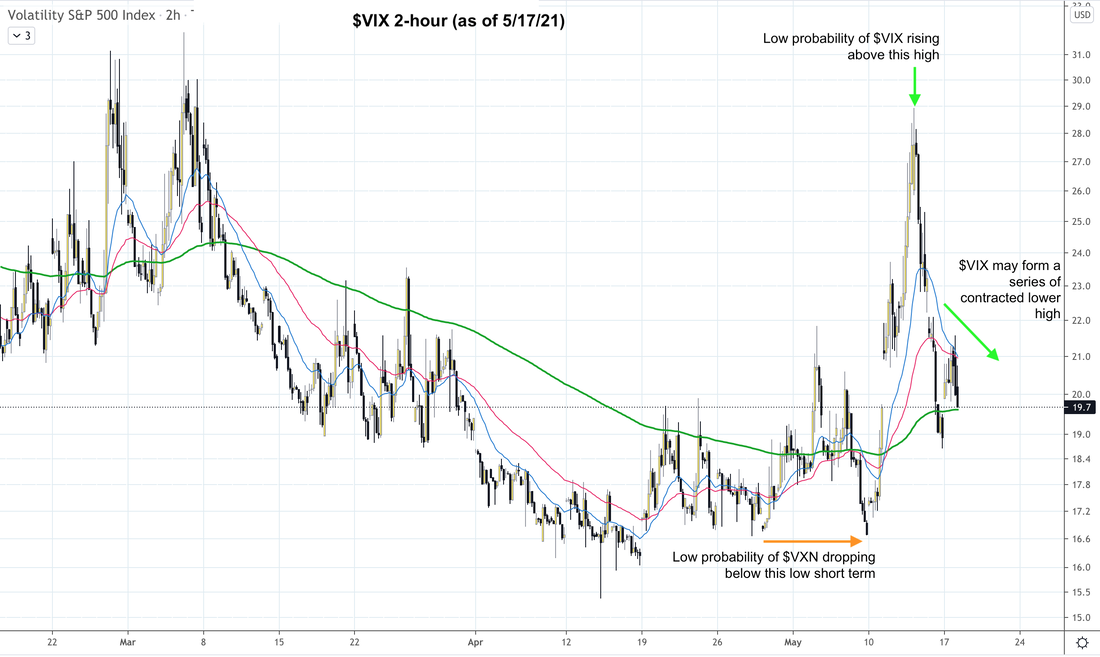 $SPX If $VIX is going to contract and form a gradual series of lower highs, $SPX is very likely going to contract into the range between its 50 EMA red line and its green support zone. 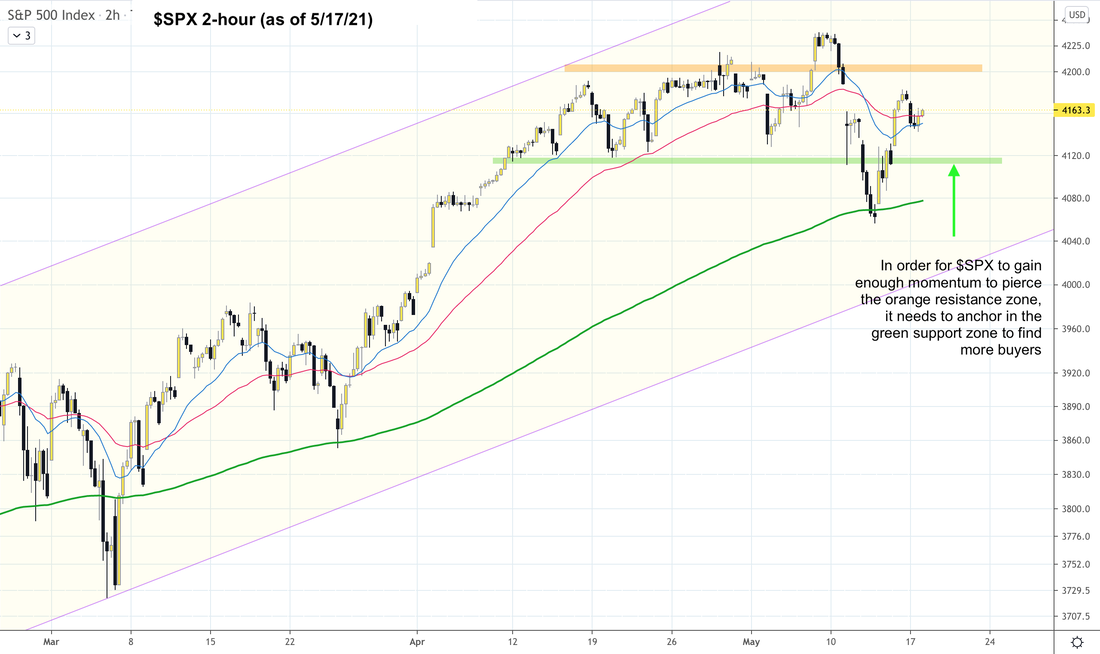 $RVX 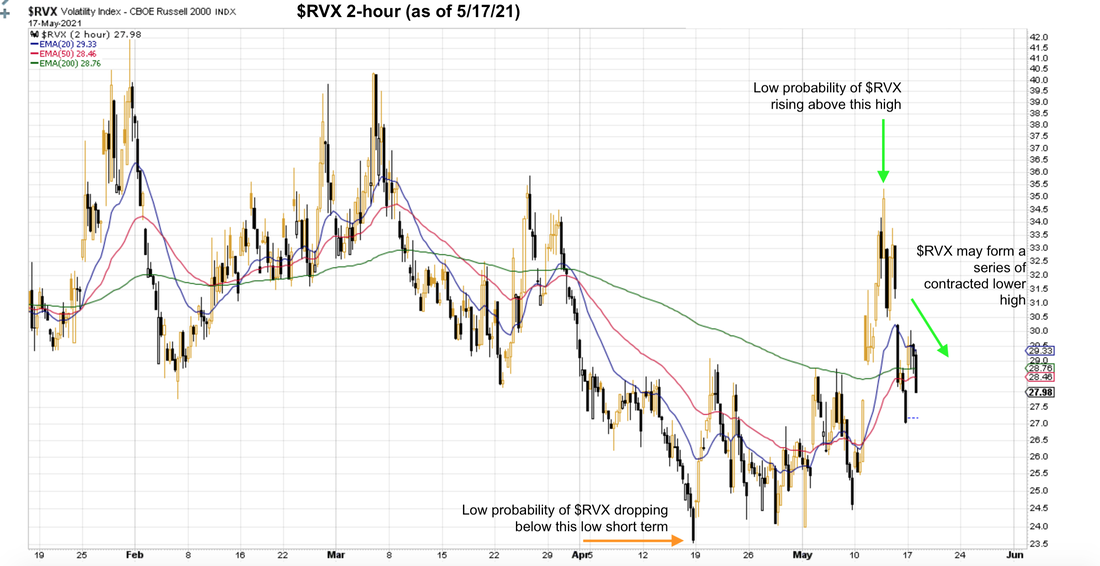 IWM If $RVX is going to contract and form a gradual series of lower highs, IWM is very likely going continue it sideway moves, crisscrossing above and below its 200 EMA green line. 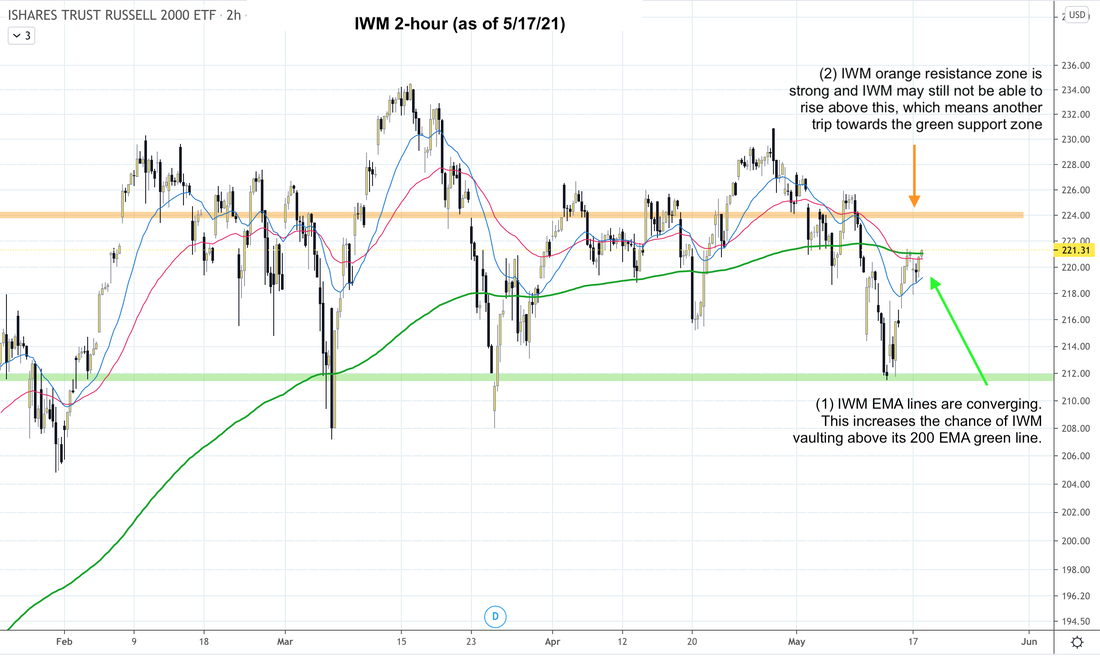 Signal Trades The most important thing to keep in mind is this. $NDX $SPX IWM are all likely going to rise into a biggish up swing at some point in the next couple weeks. Some time in June, $SPX is likely to revisit is May high, $NDX its April high, and IWM its March high. The odds of $NDX $SPX IWM dropping substantially lower than their 5/12 low is quite low. In Signal Trades we are going to leave the buy targets as is, but we plan to adjust them once the sideway pattern emerges. Click here for Signal Trades. To Read We urge you to read this article about risk management and position sizing. 1% Risk Rule If you are new to trading 3x leveraged ETFs like TQQQ TNA SOXL FNGU, read: Why 3x ETFs like TQQQ lose money over the long term If you are new to trading inverse ETFs like SQQQ TZA SOXS FNGD, read: The risks of investing in inverse ETFs Disclaimer The information presented here is our own personal opinion. Consider it as food for thought. We are not offering financial advice. We are not promoting any financial products. We are not registered financial advisers or licensed brokers. We make no guarantee that anything will unfold according to our projections. You are proceeding at your own risk if you follow our suggestions. Entry/exit signals for SPY QQQ TQQQ IWM SPX NDX based on VIX. Click here for our Signal Trades. Updates 2:30 AM EST- Friday 5/14/21 Perspective Friday's economic reports are likely to move the market into another big swing. The question is which way. The answer is both. We'll explain below. Table of Support & Resistance Zones The S/R table below has been updated. The green support zone is where this current major pullback may end. The orange resistance zone is short-term strong resistance level. Read the rest of this analysis, and get the latest entry/exit signals for SPY QQQ TQQQ IWM SPX NDX based on VIX here. $NDX Weekly $NDX weekly chart shows a bearish divergence between price and RSI. This is yet another indicator that echos the bearish message from A/D and Put/Call ratio. This tells us that while we may see enthusiastic bounce from recent drops, in the big picture context, $NDX (like IWM) is quite vulnerable. 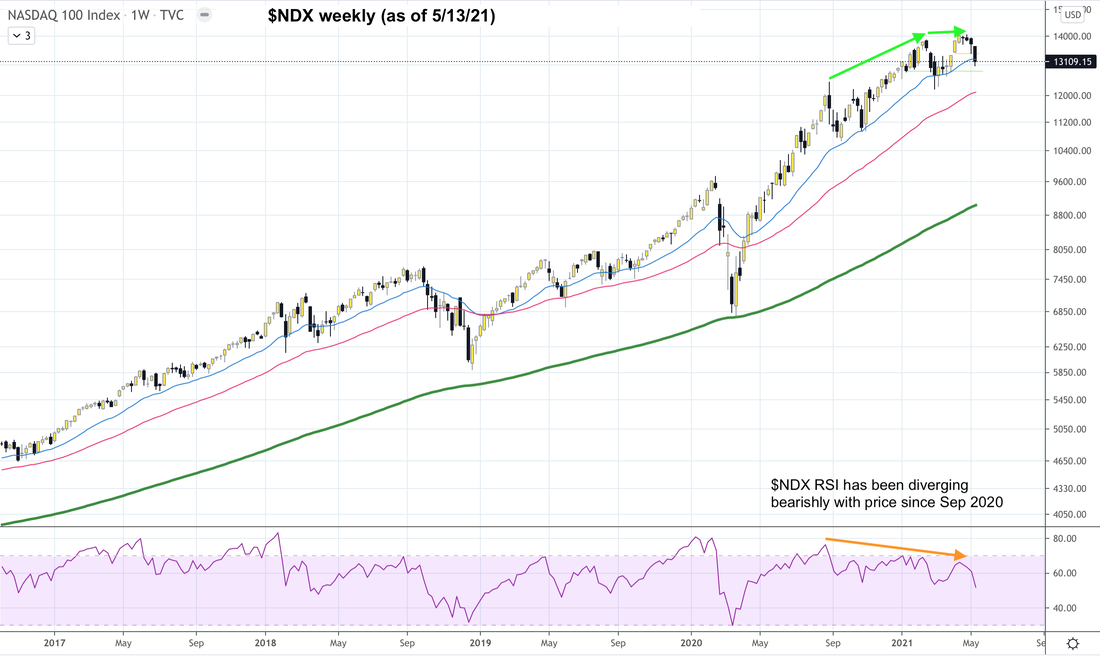 Click here for our latest buy targets in Signal Trades. Entry/exit signals for SPY QQQ TQQQ IWM SPX NDX based on VIX. Click here for our Signal Trades. Updates 2:30 AM EST- Thursday 5/13/21 Perspective Market was not happy about the CPI report on Wednesday morning. As a result, $SPX $NDX IWM all dropped sharply, and $VIX $VXN $RVX surged up substantially. We shared with you yesterday warnings from various indicators: It appears that $NDX is continuing the process of pulling back, much more so than $SPX and IWM. There are important indicators sending out highly bearish messages about $NDX. They confirm that the sell-off may be substantial. Now we need to determine the potential scope of this major pullback. Could it be a crash? Table of Support & Resistance Zones The S/R table below has been updated. The green support zone is where this current major pullback may end. The orange resistance zone is short-term strong resistance level. Read the rest of this analysis, and get the latest entry/exit signals for SPY QQQ TQQQ IWM SPX NDX based on VIX here. IWM IWM weekly chart looks very vulnerable to a major drop. It may not happen right away, but IWM is now sitting just below its 20-week EMA blue line. Not finding enough support here may mean IWM eventually dropping down to its 50-week EMA red line near 190. 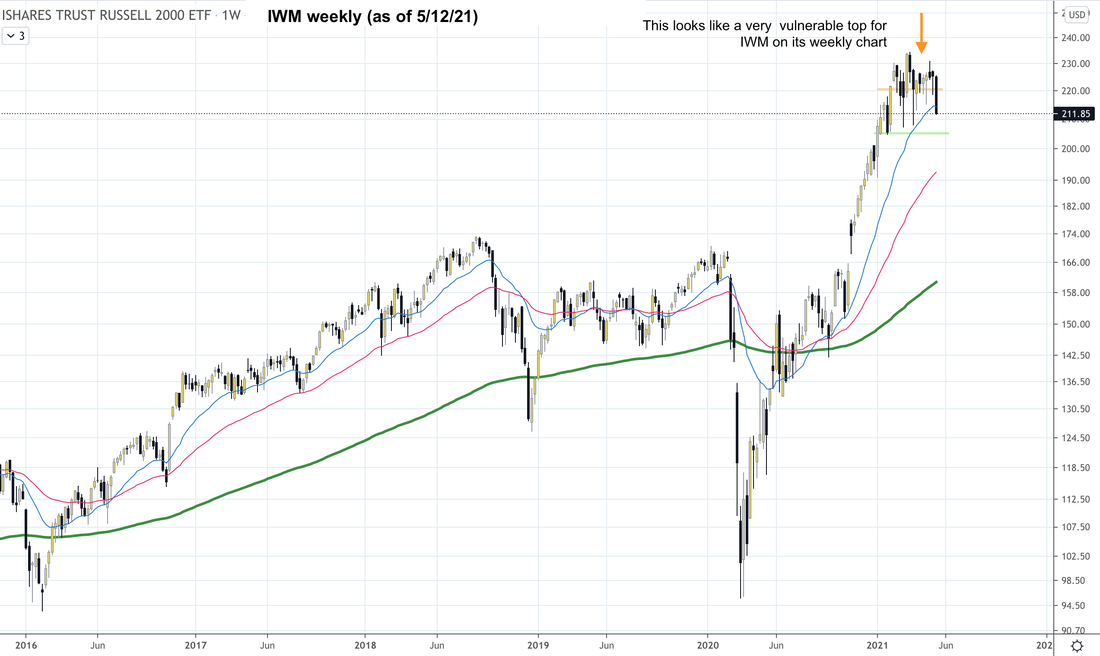 Click here for our latest buy targets in Signal Trades.
|
Archives
July 2024
Categories |
 RSS Feed
|
|
Copyright (c) 2019-2024 LOOK Systems LLC
All rights reserved. |