|
$SPX $NDX $RUT are now in Major Pullback5. Futures are showing a bit of a bounce in price tonight. Here are some key questions to ponder:
It turns out that there is a wealth of information in $VIX $VXN charts to help guide us in deciphering the bottom. And we have found that volatility charts are much more reliable in their signals than price charts. You are not as likely to fall into bull or bear traps. But $VIX $VXN charts are not easy to decipher. So read our latest trading plan for analytical techniques to determine the answers to these questions. The full article covers: Short-term Support & Resistance Levels
Market Internal Indicators
Market Projections and Trading Plan
Subscribe to read the full article.
2 Comments
$SPX $NDX $RUT continued to drop on Fri 2/21. This stirred up talks of rate cuts. The Fed is murmuring soothing noises, and they are still pumping money into the system, but the scary part is they may be out ammunition when the economy really falls apart.
From Bloomberg: "Federal Reserve policy makers sound cautiously confident they’ve got interest rates about right as they assess the fallout from the spreading coronavirus. What worries them though is their ability to rescue the U.S. economy should things go horribly wrong.” This certainly does not instill long term confidence, but market participants are likely to be satisfied with more short term rate cuts, and more easy money for now. What this means is that in the short term, we most likely won’t see an end to the current Up Trend just yet. However, the market and the economy are increasingly vulnerable to events with big bearish consequences. And when things fall apart in a big way, the Fed may not be able to come to the rescue effectively. Support & Resistance Levels The S/R levels below are short-term projections of important price levels. These are places where the majority of buyers and sellers are likely to lurk. You will want to pay attention to the change in price behaviors around these levels. Read the full article to get the complete analysis. The full article covers: Short-term Support & Resistance Levels
Market Internal Indicators
Scenarios to monitor for on Mon
Market Projections and Trading Plan
Subscribe to read the full article. Futures are down as we write this on Wed evening 2/19. Market participants are starting to get more nervous about the growing infection rate worldwide, and the economic impact of the coronavirus, as demonstrated by Apple's warnings on Tue.
"Goldman Sachs sounded the alarm to clients about a possible correction in the stock market, noting investors are underestimating how big of a risk the coronavirus really is." According to Goldman: “While a sustained bear market does not look likely, a near-term correction is looking much more probable.” -CNBC So does this mean $SPX $NDX $RUT will undergo a Big Dip or a Major Pullback starting tomorrow? What's happening to Surge11 of the Up Trend? Read the full article to get the complete analysis. The full article covers: Market Internal Indicators
Short-term Support & Resistance Levels
Market Projections and Trading Plan
Subscribe to read the full article. Market Expecting More Easy Money
The current rise in stocks is mostly fueled by easy money from the Fed. The Fed, however, is engaged in some interesting maneuvers, taking money out of the system with the right hand, and putting it back in with the left hand. The net result still appears to be increased liquidity. This is most evident in market breadth. It is climbing to higher highs most days for NYSE stocks. Furthermore, traders are expecting the Fed to come to the rescue when the economic impact of the coronavirus is realized. Imagine how the market will react if the Fed suddenly decides that the situation doesn’t warrant a rate cut. Corona tantrum! Keep this situation in mind as we discuss the long-term and short-term portfolios below. The full article covers: Market Internal Indicators
Short-term Support & Resistance Levels
Market Projections and Trading Plan
Subscribe to read the full article. We received lots of messages today about $NDX making a new all-time high. And indeed it seems very exciting. Just as exciting as TSLA parabolic rise on Feb 4.
Many traders like to join the party and buy when prices reach a new high. Alas, this is a dangerous signal to rely on. If you had bought QQQ at a new all-time high on 1/12/18, you would have felt great. If you had bought QQQ at a new all-time high on 1/26/18, you probably lost sleep on many nights subsequently, and lost a lot of money too as QQQ dropped over 12% in a few days. Many times stocks run away from the underlying health of the market. This happened over and over again: in late 1999, in late 2007 and early 2008, in late 2015, in late 2017 and early 2018. Over and over again, traders and investors don’t learn from this mistake. FOMO gnaws at all of us. We fear that we are missing out on a great party. We throw caution to the wind. We jump in and buy. We party like it’s.. well 1999. If you are a nimble short-term trader, you can make a lot of profit in this kind of market. But you may want to think twice about deploying fresh capital into long-term or medium-term positions right now. Stocks will not continue to keep going up, up, and away. The full article covers: Market Internal Indicators
Short-term Support & Resistance Levels
Market Projections and Trading Plan
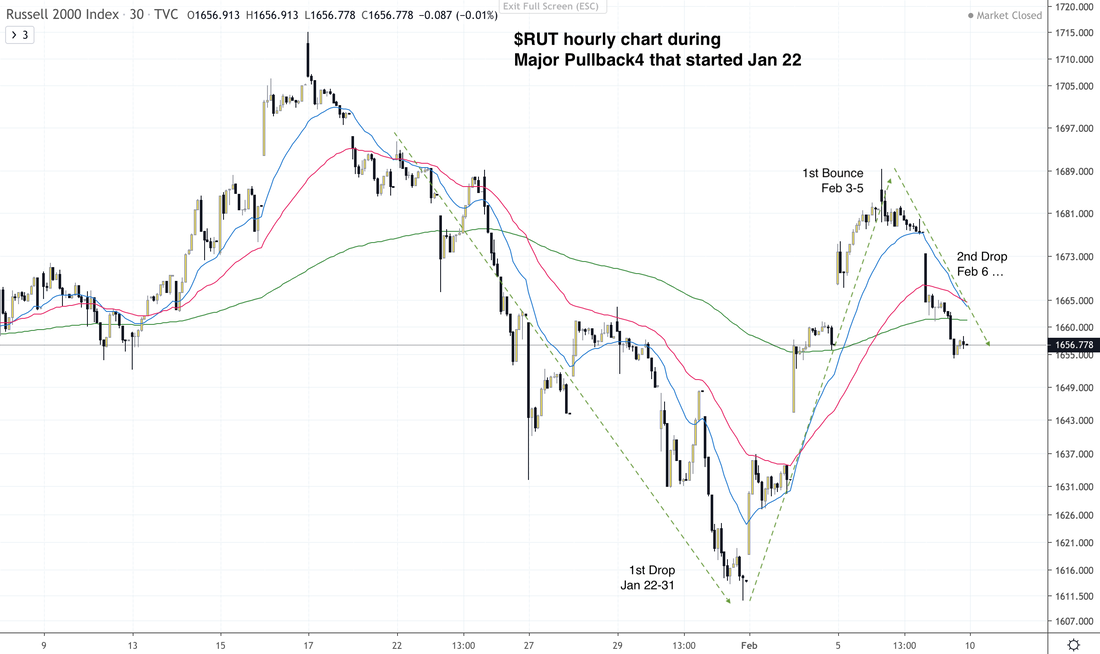
Subscribe to read the full article. How To Trade In This Market After steadily climbing upward between Oct 2019 and most of Jan 2020 (Surge10), $SPX $NDX $RUT started Major Pullback4 on Jan 22. $SPX $NDX $RUT are technically still in Major Pullback4. Even though the charts don’t show it clearly, $SPX $NDX $RUT are going through their Drop/Bounce sequence in a classic way. Let’s review the movements of Major Pullback4 so far. Please note that we characterize these movements by what shows up in market internal messages, not necessarily by the appearance on the chart. However, if you want to compare to a price chart, take a look at $RUT. It has the most classic appearance.
 Trading Major Pullback4 is similar to trading Down Market. Traders need to be aware that prices are not going to steadily march down in a stair-stepping pattern like what they did while they marched up for most of the last 4 months (Surge10). Instead, down markets are characterized by sharp Drops, followed by sharp Bounces. The effect is equivalent to riding a fast elevator. Traders need to decide ahead of time what they can stomach. The choices are:
Market internals will give us some intermediate clues as to when a Drop/Bounce starts and ends. But we caution you in thinking you can nail it end to end. It is better for your profits and inner peace if you simply aim to take a good chunk of profits from the middle of the price swing. Doing that while trading small and protecting your positions will help you to maximize your gains and minimize your loss. Market internals will also send out fairly reliable signals when they are turning bullish at the end of Major Pullback4. They usually will do so before the bullish mood actually shows up in prices. The bullish signals from market internal indicators will be our clue that Major Pullback4 is ending, and Surge11 is starting. In the sections below, we will discuss what the reliable end-game signals are for Major Pullback4. The full article covers: Market Internal Indicators
Short-term Support & Resistance Levels
Market Projections and Trading Plan
Subscribe to read the full article. $SPX $NDX reached Resistance1, got stuck and are getting sold prior to the weekend. The short squeeze that was threatening to bring IWM back to its Jan high did not materialize. Instead, $RUT IWM TNA rolled over. Volatility ($VIX $VXN) is rising as complacency (SVXY) dropped. Read our full article to position yourself ahead of the weekend.
The full article covers: Market Internal Indicators
Short-term Support & Resistance Levels
Market Projections and Trading Plan
Subscribe to read the full article. $NDX continues to rise to new all-time highs. $SPX appears to have recovered. TSLA has gone parabolic. So why are we bearish?
The answer is that market internal indicators have been sending bearish messages since Jan 22. Sooner or later, speculators will wake up to the fact that under the hood, stocks are primed for selling rather than buying. And the rush to exit won’t be pretty. The full article covers: Market Internal Indicators
Short-term Support & Resistance Levels
Market Projections and Trading Plan
Terminology
We would like to welcome our new members and explain terminology that we’ve been using. $SPX $NDX have been in the Up Trend since 12/26/18. During this Up Trend, $SPX $NDX experienced three Major Pullbacks between 12/26/18 and 1/24/20.
After Major Pullback3, Surge10 started on 10/3/19. Surge10 ended for $SPX on 1/22/20, and ended for $NDX on 1/24/20. We are now in Major Pullback4. Our trading system based on market internal indicators issued a bearish signal calling for a short-term top on Jan 22. Our readers had 2 days of warning before market took a serious dive. Our trading system also identified in advance the bounce that started on Jan 28. We urged traders to exit long positions based on $SPX $NDX in preparation for Major Pullback4. On Jan 30, our trading system issued another bearish message. We showed you a highly bearish dashboard of market internal indicators. The following day on Fri Jan 31, $SPX $NDX $RUT all went into selling mode. Since our system issued the first bearish signal on Jan 22, $SPX and $NDX are down over 3%. Meanwhile the inverse bearish ETF SQQQ has gone up 9.25%. $SPX $NDX are now in Major Pullback4. We don’t have enough data yet to determine whether Major Pullback4 will truly turn into a new Down Trend, or whether we will have Surge11 that follows Major Pullbackk4. So how do we do short-term and intermediate term trades of this new phase? Should we get out of stocks in our long-term portfolios? Read on. The full article covers: Market Internal Indicators
Short-term Support & Resistance Levels
Market Projections and Trading Plan
Subscribe to read the full article. |
Archives
July 2024
Categories |
 RSS Feed
|
|
Copyright (c) 2019-2024 LOOK Systems LLC
All rights reserved. |