|
Click here for Signal Trades spreadsheet. Updates 12 PM ET - Wednesday Sell order got filled for SOXS We may have been too conservative in estimating today's sell-off, but pocketing partial profit is still a good thing. For info on how this SOXS position was entered, click here.  Updates 11:31 AM ET - Wednesday Key support zones coming up Things got bearish faster and deeper than we expected, but we did expect the selling to happen.
This Level 2 dip is not technically done yet. We need a clearer top on VIX VVIX UVXY charts. Also in terms of timing, we may see choppy bottom starting to form for the remainder of this week. NQ SOXL may not start to rise back up the channel until Monday. Our sell order for SOXS position got filled. If you are still holding SOXS, it may go as high as 21.75 - 22. Updates 12:55 AM ET - Wednesday Upcoming key events  VIX UVXY still suggesting Level 2 dip is in progress VIX 30-min chart below shows a rising 200 EMA green line. As well VIX 20 EMA blue line and 50 EMA red line have crossed above the 200 EMA green line. This implies that the dip is still in progress.  Instead of looking at UVXY chart, sometimes it's more helpful to analyze the inverse SVIX chart. Observe that SVIX has formed a top since July 12, and is about to drop out of the bottom of its purple channel. The last 2 times this happened, the Level 2 dip accelerated into a climax. We may very well see that between now and early next week.  VVIX 30-minute chart pattern is currently unclear. So we cannot draw a conclusive message from its chart right now. NQ
 SOXL
We entered into half position of SOXS after CPI Thursday morning. We plan to exit at the bottom of SOXL choppy range and wait for SOXL setup. Click here for Signal Trades spreadsheet.  Disclaimer The information presented here is our own personal opinion. Consider it as food for thought. We are not offering financial advice. We are not promoting any financial products. We are not registered financial advisers or licensed brokers. We make no guarantee that anything will unfold according to our projections. You are proceeding at your own risk if you follow our trades.
0 Comments
Click here for Signal Trades spreadsheet. Updates 4 PM ET - Thursday Entered into SOXS bear position right after CPI Ahead of CPI report, we wrote: Look for the scenario where VIX dips right after CPI to get close to 12 once again. After this last anchoring process, VIX may then start to spike. This scenario means NQ SOXL will likely rise some amount post CPI. That is pretty much what happened post CPI. After NQ SOXL both spiked up sharply, and VIX dropped sharply, we observed a dramatic reversal. So we entered 1/2 position SOXS as planned. We decided not to add to this position because SOXS was taking off too fast, and this is just a Level 2 dip which means the dip won't be that big or lasts for that long.  Updates 2:15 AM ET - Thursday Upcoming key events  VIX VVIX UVXY: Patterns building up towards a Level 2 dip setup By end of day Wednesday:
You can see these patterns in the charts below.    Does this mean Level 2 dip is officially starting? These charts above suggest that VIX VVIX UVXY are now starting to generate bearish conditions for equity, conditions that typically lead to a dip, a Level 2 in this case. But bearish conditions do not mean that NQ SOXL will drop instantly into a dip. Bearish conditions mean bulls should think about protecting your profits. Bears can monitor for setups to short. But the setups have to be really "ripe", and the short positions probably will not last any more than 3-4 days. NQ
 SOXL
Until we see a clear short setup on SOXS charts, we are not entering anything yet. But in the spreadsheet, we have shown a possible buy order for SOXS trade setup just to give you an idea of what to look for. Click here for Signal Trades spreadsheet.  Disclaimer The information presented here is our own personal opinion. Consider it as food for thought. We are not offering financial advice. We are not promoting any financial products. We are not registered financial advisers or licensed brokers. We make no guarantee that anything will unfold according to our projections. You are proceeding at your own risk if you follow our trades.
Updates 4 PM ET - Monday Tight stops protected our profit Bull Runner SOXL: On Wednesday Feb 7, we entered a half position of SOXL when NQ started breaking out. We have been holding this as a runner to capture NQ rising to 18200. (Today NQ reached 18122 and then dropped.) Bull Runner TNA: On Thursday Feb 8 , we re-entered a half position of TNA when RTY formed a big W bottom on its hourly chart. We held this as a runner to capture RTY rising to 2060. (Today RTY reached 2061 and then dropped.) Today VIX started rising sharply so per our discussion below, we tightened the stop and got stopped out of both TNA and SOXL for good profit when the afternoon selling kicked in. 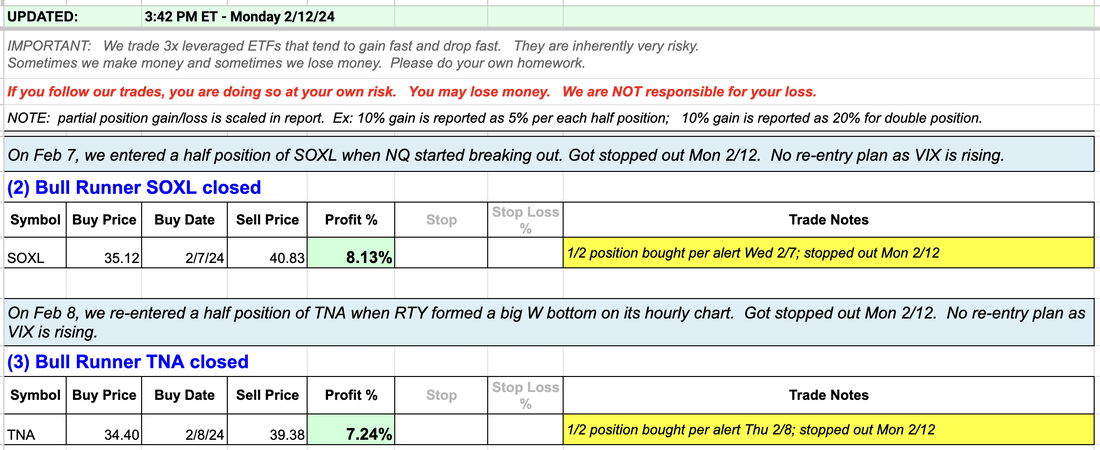 Updates 12:20 PM ET - Monday VIX is rising >> Choppy Bull emerging We posted earlier (see below) that we need to monitor for rising VIX and UVXY. VIX gapped up overnight and now they are both steadily rising this morning. This means the Strong Bull mode may be transitioning to Choppy Bull mode, with moderate dip as a possibility for ES NQ RTY. It won't happen right away but now is the time be cautious with our bull positions. We have been tightening stops on both our SOXL and TNA runner positions. SOXL got stopped out for a good sized profit. TNA is still intact and rising. Click here for Signal Trades spreadsheet. Updates 1:10 PM ET - Sunday Upcoming key events If you are into excitement, this is the week for you with plenty of economic news, along with VIXEx and OpEx. Market is sure to have some big moves. The question is what will they be. Read more economic analysis here, and read on. 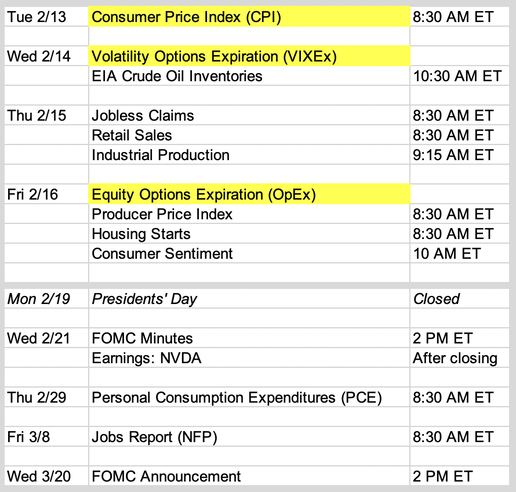 Strong Bull market mode continues Technically ES NQ RTY are back in Strong Bull mode, and this may continue until OpEx on Friday Feb 16. McClellan Oscillator for both NYSE and Nasdaq (Stockcharts.com $NYMO $NAMO) are showing higher low rising bottoms. This is very good news as it indicates that equity is coming out negative phase into the positive one. Once the positive phase start for $NYMO $NAMO, it can last 4-8 weeks. This strengthens the case for Strong Bull mode to continue. 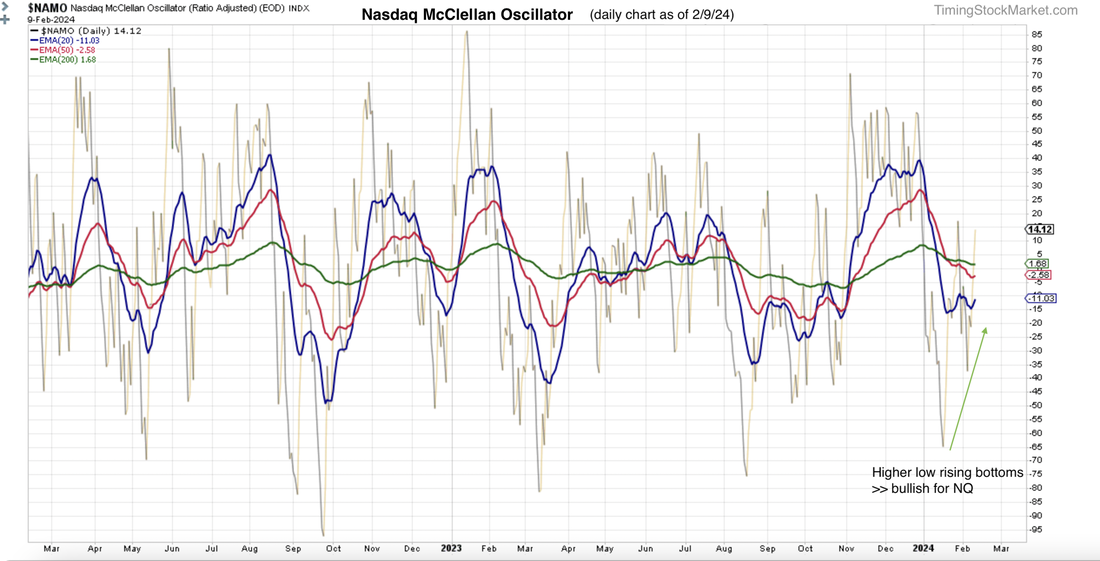 Volatility supports this Strong Bull mode as long as VIX keeps dropping. But if VIX forms a same low base around 11.8, then it's a signal that equity may be entering Weak Bull mode. In this mode, VIX is likely to climb back up to 15.2, possibly reaching 16.5 eventually. Weak Bull mode can lead to a big dip for ES NQ RTY. So keep an eye on what VIX does at this level. Keep an eye on UVXY also. If UVXY does not drop below 6.94 and instead starts to base early this week, then equity may be switching to Choppy Bull mode. Choppy Bull mode can may result in a moderate dip for ES NQ RTY. After the dip, we should see enough buyers coming back to turn the market into Strong Bull mode again. There is no setup for a Strong Bear market on the horizon right now. 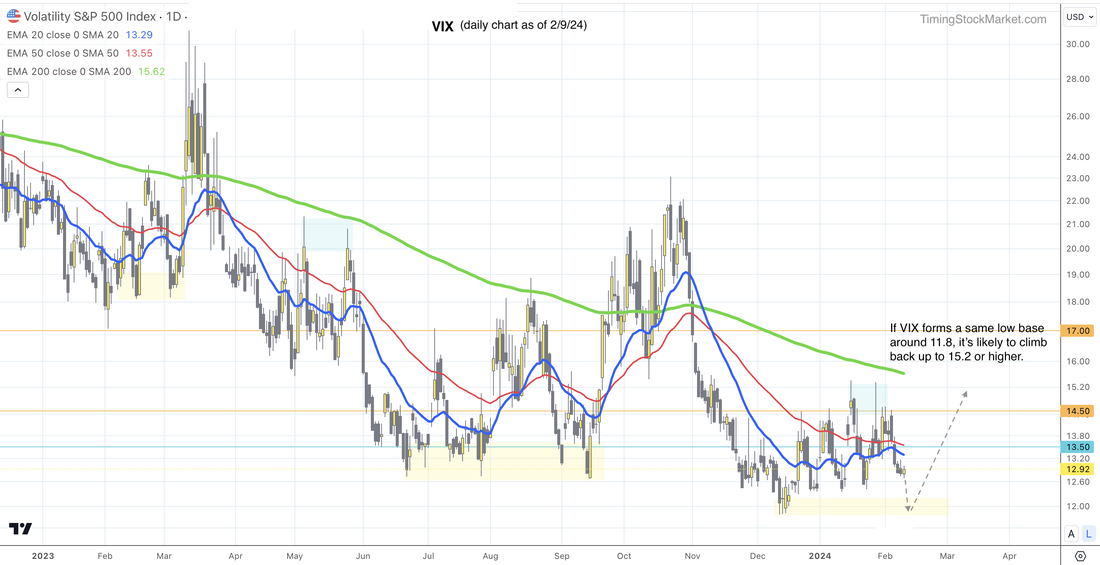 Key S/R levels NQ:
ES
RTY
Our personal trade plan 1. Bull Quick Profit SOXL: We will be looking for a shallow intraday dip to re-enter SOXL for a QP (Quick Profit) trade. 2. Bull Runner SOXL: On Feb 7, we entered a half position of SOXL when NQ started breaking out. As long as NQ remains in Strong Bull mode, we plan to hold this as a runner to capture NQ rising to 18300. 3. Bull Runner TNA: On Feb 8, we re-entered a half position of TNA when RTY formed a big W bottom on its hourly chart. As long as RTY remains in Strong Bull mode, we plan to hold this as a runner to capture RTY rising to 2097. Note that if we see the VIX W bottom or UVXY basing as discussed above, we'll manually exit all bull positions because the dip will knock out our positions. Click here for Signal Trades spreadsheet. Disclaimer The information presented here is our own personal opinion. Consider it as food for thought. We are not offering financial advice. We are not promoting any financial products. We are not registered financial advisers or licensed brokers. We make no guarantee that anything will unfold according to our projections. You are proceeding at your own risk if you follow our trades.
Updates 9:11 AM ET - Monday Strong Bull mode continued overnight ES NQ RTY all shot up overnight, with ES tagging 5040 as projected. We plan to continue holding the two runner positions TNA and SOXL and will monitor for intraday pullback to enter SOXL for the Quick Profit trade. It may or may not come, but it has certainly been a decent week for the bulls. 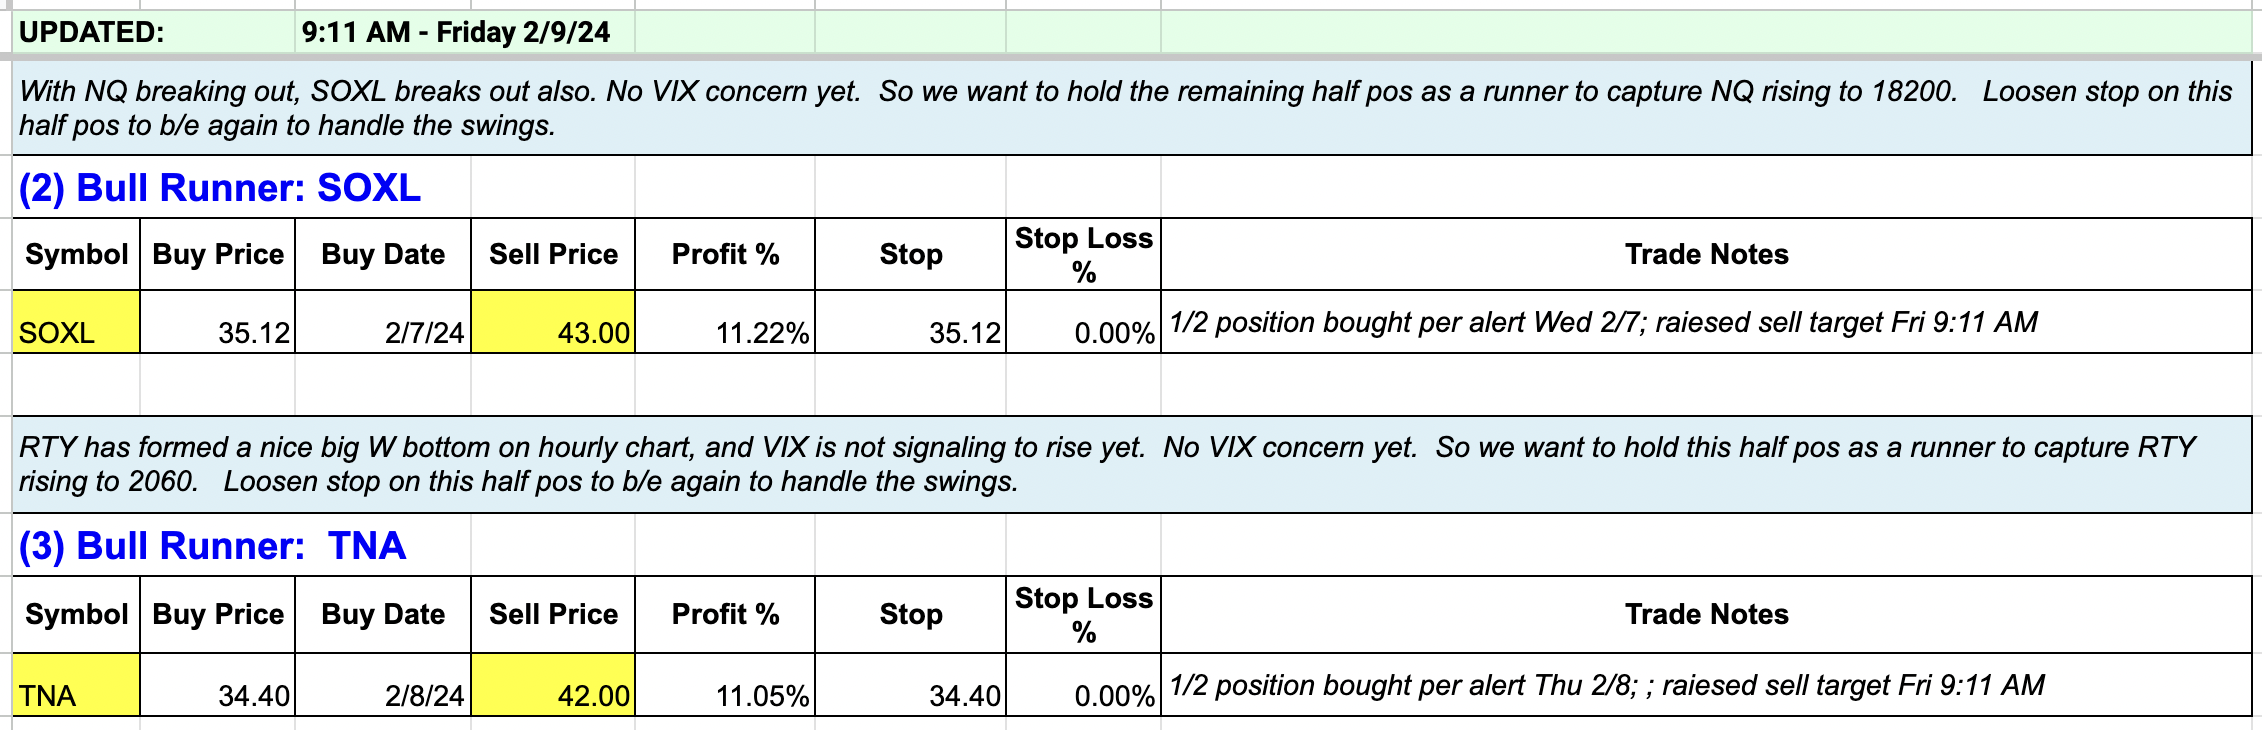  Big picture: bull market; short-term: strong buying momentum returns Technically ES NQ RTY are back in Strong Bull mode, and this may continue until OpEx on Friday Feb 16. So what could go wrong to wreck this party? VIX. We will be monitoring for these patterns that shows when volatility is most likely going to rise.
If VIX starts to rise from here, then the signal for the Strong Bull mode has failed. And a failed signal will send the market in the opposite direction quickly. In other words, instead of a Strong Bull, we'll get a very Weak Bull with lots of selling that can lead to a substantial dip. But until these patterns show up, the Strong Bull is in charge. Key S/R levels NQ levels and pattern have not changed. NQ has broken out above resistance at 17775. While it may quickly dip to retest 17725 on Friday, NQ will march up and will reach 18000 soon. NQ may even reach 18200 by OpEx. Short-term support lies at 17475. ES levels and pattern have not changed. ES has broken out above resistance at 5000. While it may quickly dip to retest 5000 on Thursday, ES will march up and will reach 5040 soon. ES may even reach 5075 by OpEx. Short-term support lies at 4980. RTY has formed a beautiful W bottom between Monday and Thursday this week to retest 1925 again. We can see this clearly on RTY hourly chart. RTY broke out of this bottom on Thursday morning, and is likely to rise up to 2060 possibly by OpEx. Our personal trade plan 1. Bull Quick Profit SOXL: On Thursday Feb 8, we did an intraday tactical trade and collected a small profit on half position of SOXL. We plan to repeat this on Friday if we get a bullish setup to re-enter SOXL. 2. Bull Runner SOXL: On Wednesday Feb 7, we entered a half position of SOXLwhen NQ started breaking out. We plan to hold this as a runner to capture NQ rising to 18200. 3. Bull Runner TNA: On Thursday Feb 8, we re-entered a half position of TNA when RTY formed a big W bottom on its hourly chart. We plan to hold this as a runner to capture RTY rising to 2060. Note that if we see any of the VIX or UVXY pattern discussed above, we'll manually exit all bull positions. Click here for Signal Trades spreadsheet. Disclaimer The information presented here is our own personal opinion. Consider it as food for thought. We are not offering financial advice. We are not promoting any financial products. We are not registered financial advisers or licensed brokers. We make no guarantee that anything will unfold according to our projections. You are proceeding at your own risk if you follow our trades.
Updates 7:25 PM ET - Thursday Traded SOXL and TNA 1. Bull Quick Profit SOXL: Today we did an intraday tactical trade and collected a small profit on half position of SOXL. 2. Bull Runner SOXL: On Wednesday Feb 7, we entered a half position of SOXL when NQ started breaking out. We continue to hold this as a runner to capture NQ rising to 18200. 3. Bull Runner TNA: Today we re-entered a half position of TNA when RTY formed a big W bottom on its hourly chart. We plan to hold this as a runner to capture RTY rising to 2060. 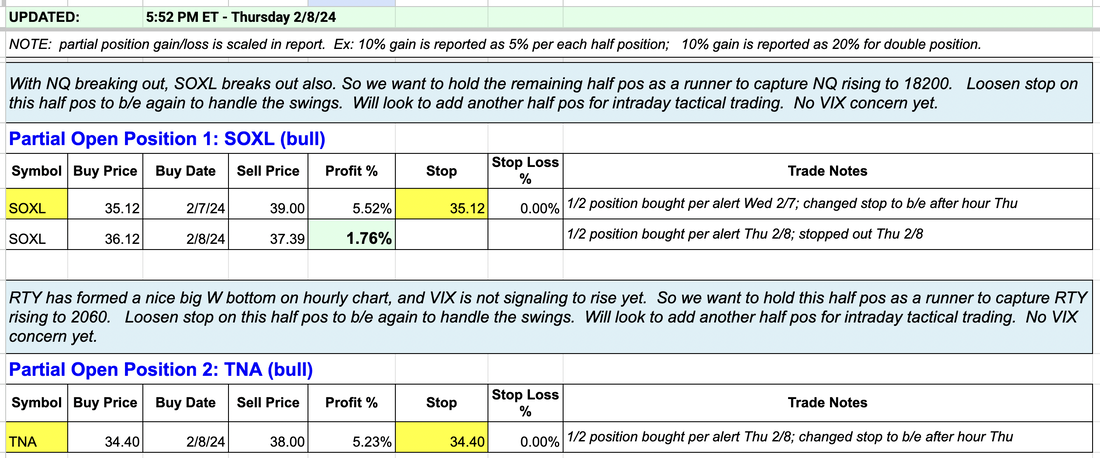  Big picture: bull market; short-term: strong buying momentum returns On its 4-hour chart, VIX 20 EMA blue line just crossed below its 200 EMA green line. This is bullish for equity, even if it's just short term. On their hourly charts S&P and Nasdaq Advance-Decline Percents (Stockcharts $SPXADP $NDXADP) continue to form W bottom. This implies at least a short-term rise for ES and NQ. McClellan Oscillator for both NYSE and Nasdaq (Stockcharts $NYMO $NAMO) both are forming W bottom on their daily charts via their 20-day EMA lines. This implies at least a short-term rise for ES and NQ. 10-year yield (US10Y) is basing. It may rise from here, but the basing process is going to take some time and meanwhile yield is likely to drop short term. Key S/R levels NQ has broken out above resistance at 17775. While it may quickly dip to retest 17725 on Thursday, NQ will march up and will reach 18000 soon. NQ may even reach 18200 by OpEx. Short-term support lies at 17475. ES has broken out above resistance at 5000. While it may quickly dip to retest 5000 on Thursday, ES will march up and will reach 5040 soon. NQ may even reach 5075 by OpEx. Short-term support lies at 4980. RTY is likely to retest 1925 again. If it finds enough support here, it will form a W bottom for a big rise up to 2060 eventually. However, if RTY drops below 1905, then selling will accelerate and can drop RTY down to key support at 1835. Our personal trade plan Bull position 1: We entered a half position of SOXL when NQ started breaking out. We look to add the remaining half SOXL on Thursday. Bull position 2: We tested the bullish rise in TNA when RTY found support at the morning low. However, after hour price actions showed RTY likely to test 1925 again. This means TNA is likely to retest 32.7. So we exited TNA to possibly re-enter at a lower price on Thursday. Click here for Signal Trades spreadsheet. Disclaimer The information presented here is our own personal opinion. Consider it as food for thought. We are not offering financial advice. We are not promoting any financial products. We are not registered financial advisers or licensed brokers. We make no guarantee that anything will unfold according to our projections. You are proceeding at your own risk if you follow our trades.
Updates 7:25 PM ET - Wednesday Scaling into SOXL 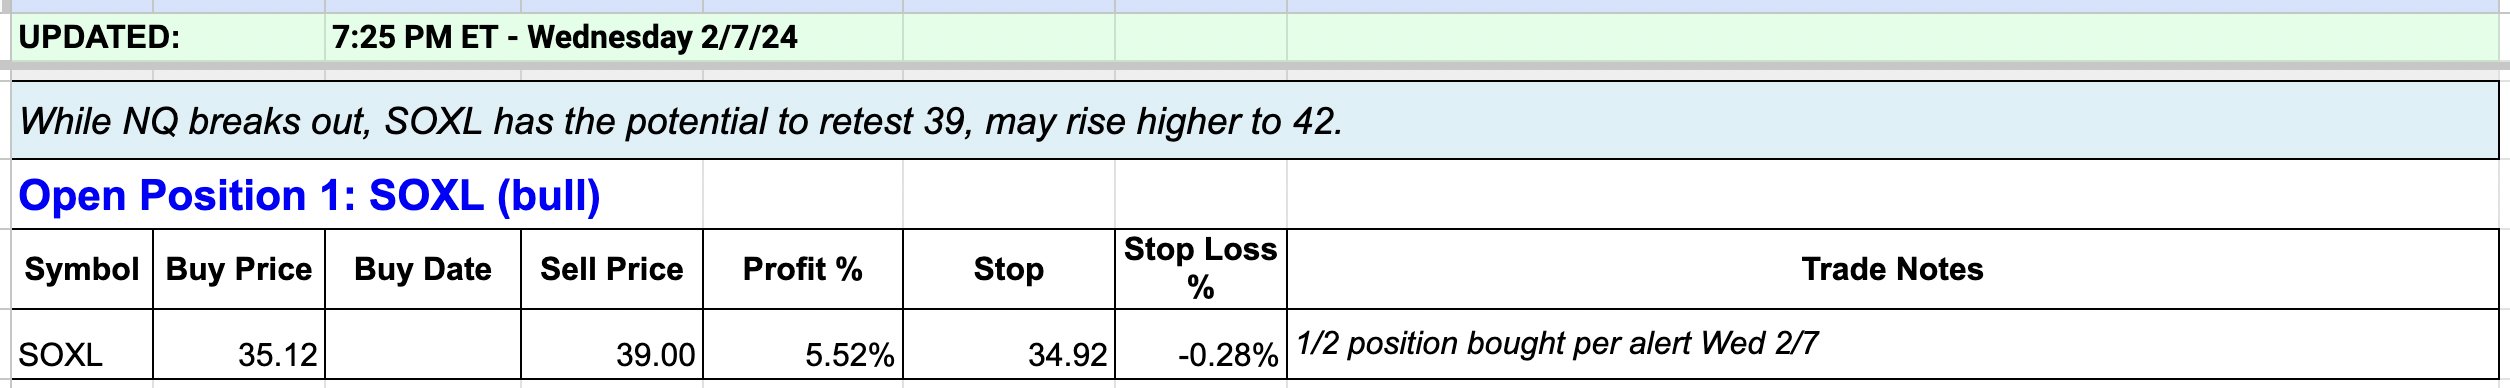  Big picture: bull market; indicators are signaling bullish turn On its 4-hour chart, VIX 20 EMA blue line just crossed below its 200 EMA green line. This is bullish for equity, even if it's just short term. On their hourly charts S&P and Nasdaq Advance-Decline Percents (Stockcharts $SPXADP $NDXADP) are forming W bottom. This implies at least a short-term rise for ES and NQ. McClellan Oscillator for both NYSE and Nasdaq (Stockcharts $NYMO $NAMO) both are forming W bottom on their daily charts via their 20-day EMA lines. This implies at least a short-term rise for ES and NQ. 10-year yield (US10Y) is basing. It may rise from here, but the basing process is going to take some time and meanwhile yield is likely to drop short term. Key S/R levels ES is coiling up and likely to surpass 4997 to reach 5040 given the more bullish messages from the indicators. NQ meanwhile appears to run into resistance at 17775. Failure to rise above 17775 will lead NQ to grind its way downward, eventually down to 17000 for key support post CPI next week. Look for RTY to retest the zone from 1925 - 1935. If it finds enough support here, it will form a W bottom for a big rise up to 2050 eventually. Here's a view of RTY weekly chart which shows bullish hammers at same support level for multiple weeks. 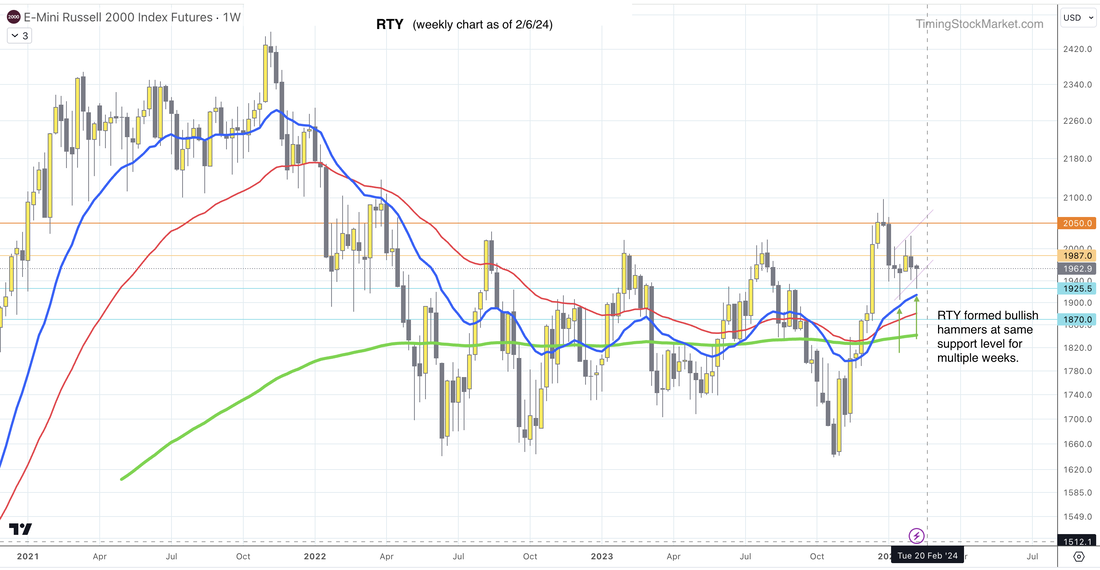 Our personal trade plan We are now positioning to scale into TNA if RTY successfully retests support. Click here for Signal Trades spreadsheet. Disclaimer The information presented here is our own personal opinion. Consider it as food for thought. We are not offering financial advice. We are not promoting any financial products. We are not registered financial advisers or licensed brokers. We make no guarantee that anything will unfold according to our projections. You are proceeding at your own risk if you follow our trades.
Updates 4 PM ET - Monday Exited SOXL We manually took profit on half of our SOXL position ahead of the weekend, and got stopped out of the remaining half today for a gain of 4.5% total. See the original entry here. 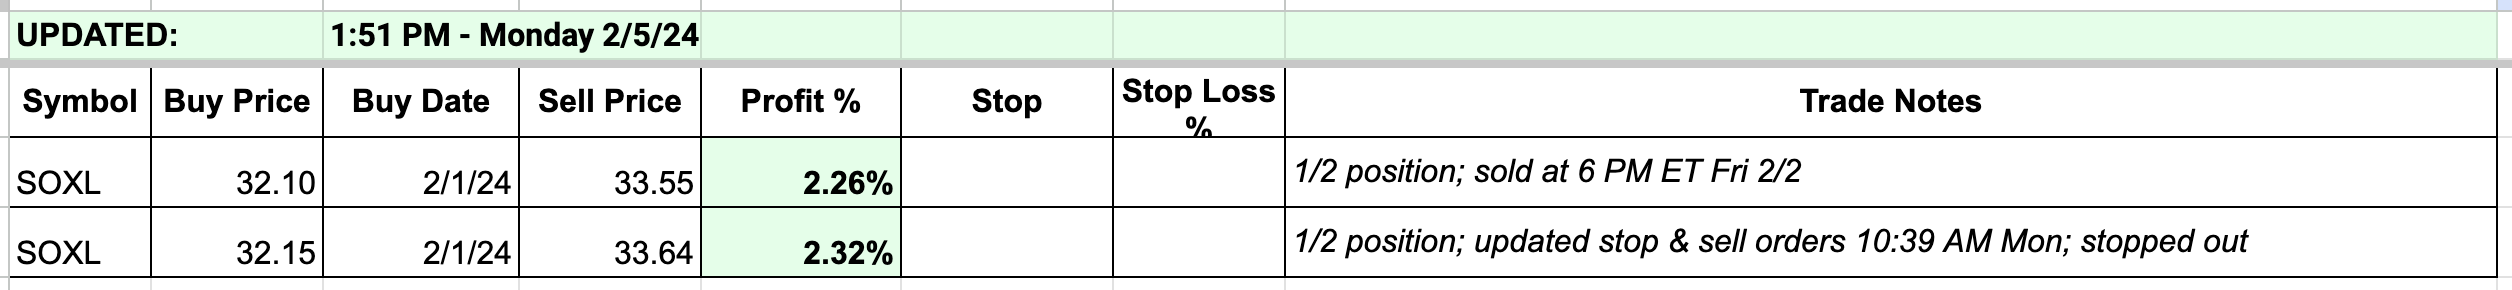 Updates 2:45 PM ET - Sunday Upcoming key events This week is much lighter in news and announcements so traders can take a break to get ready for next week's excitement. Read more economic analysis here. 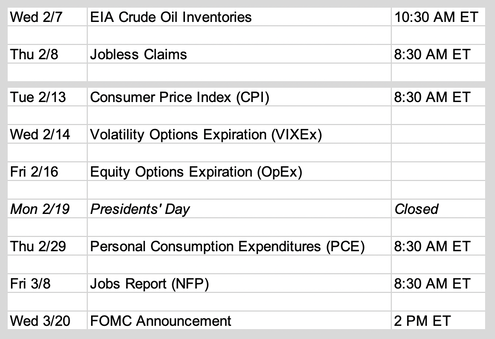 Big picture: bull market; short term: dip possible The bull trend continues, but the indicators also continue to suggest that there's bearishness building up under the hood. This is likely to lead to a dip (not a bear market). The question is how big and how long will this dip be. The indicators cannot tell us that right now, so we simply have to monitor price behaviors at key S/R levels for ES NQ RTY. Volatility rising VIX 4-hour chart below shows a flat sideway 200 EMA green line, and a coiling and rising 20 EMA blue line. This combination resulted in VIX surge back in March and August through October last year (see red arrows below). There is a good chance that this surge will happen again so bulls should protect profits here. 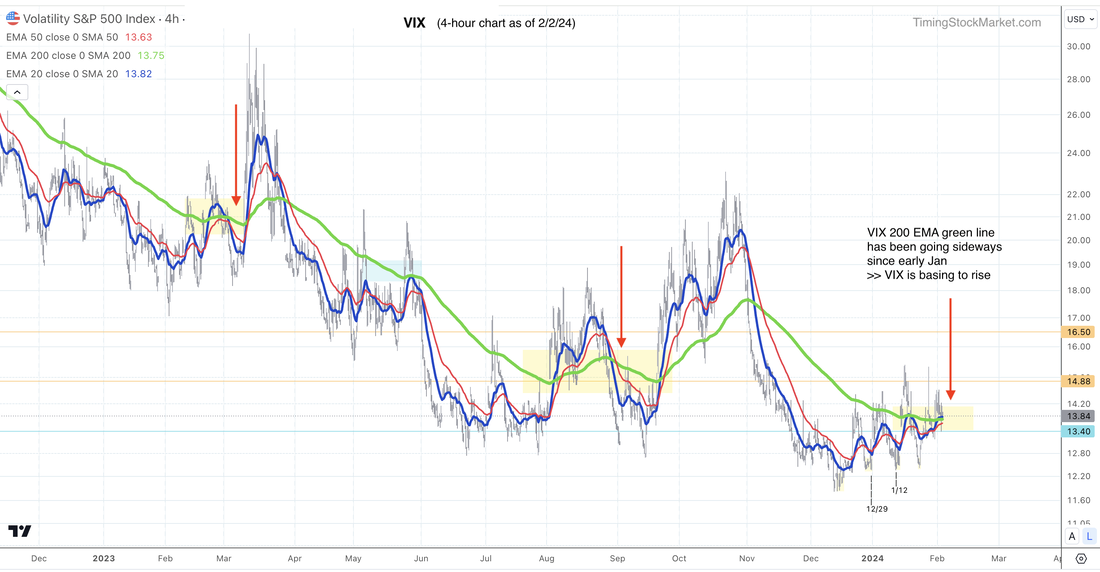 Breadth declining S&P and Nasdaq Advance-Decline Percents (Stockcharts $SPXADP $NDXADP) continue to show lower high topping patterns on their daily charts. They support the possibility of ES NQ RTY dipping to test key support levels. McClellan Oscillator for both NYSE and Nasdaq (Stockcharts $NYMO $NAMO) are back in negative territory. They confirm the above bearish messages. Rates rising After the hot job report on Friday, yields all rose sharply (US10Y; US20Y; US02Y). Junk bonds (JNK HYG) have been signaling bond selling by forming same high multi-tops since December 28. Key S/R levels NQ: Despite the messages from VIX and market breadth, NQ failed to drop to key support at 17000 after FOMC announcement. The failed signal gave it a strong push back up, and by Friday NQ is back up near the key resistance level of 17794. This level has generated three short term tops at this point, so don't be surprised if NQ spends multiple days this week chopping in this zone between 17475 and 17794. CPI report on February 13 will likely be the catalyst to either pop NQ up from this chop zone, or drop NQ down from this chop zone. Note that we are not anticipating fresh multi-week breakout or breakdown. Rather, if NQ rises out of this zone, it is likely to run into short-term top at 18000 ahead of OpEx. If NQ drops from this zone, it is likely to find buyer support at 17000 to resume the bullish climb. 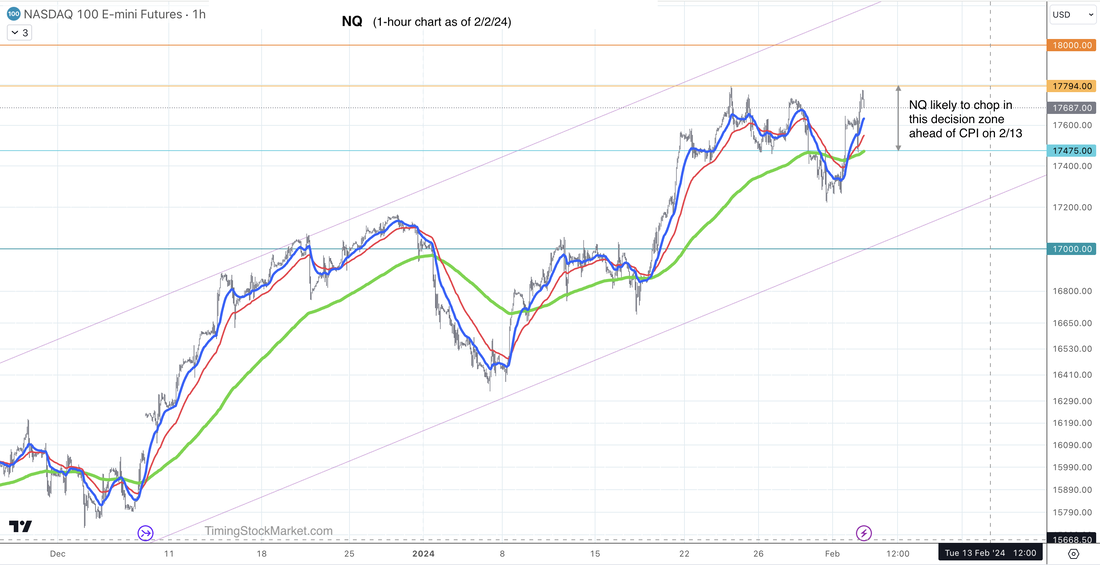 ES: Like NQ, ES failed to drop to key support at 4840 after FOMC announcement. The failed signal gave ES a strong push back up. ES is likely to spend this week digesting the gain. Look for ES to spend multiple days this week chopping in the zone between 4930 and 4997. CPI report on February 13 may be the catalyst to push ES up to short-term top at 5040 ahead of OpEx. If CPI results in bearish response instead, ES may drop from the chop zone down to 4840 before resuming the bullish climb. RTY: RTY has been dropping and is likely to continue doing so for the early part of this week. Its chop zone is 1940 - 1987. CPI report on February 13 may be the catalyst to push RTY up to short-term top at 2050 ahead of OpEx. If CPI results in bearish response instead, RTY may drop from the chop zone down to 1890. Our personal trade plan We bought SOXL on Thursday after seeing the failure to drop signal. We collected profit on 1/2 position on Friday because the bearish messages from the indicators made us nervous. We are still holding the other half of SOXL to reach sell target. Click here for Signal Trades spreadsheet. Disclaimer The information presented here is our own personal opinion. Consider it as food for thought. We are not offering financial advice. We are not promoting any financial products. We are not registered financial advisers or licensed brokers. We make no guarantee that anything will unfold according to our projections. You are proceeding at your own risk if you follow our trades.
Updates 4 PM ET - Thursday Entered into SOXL NQ failed to drop to test support at 17000 today. We used this fail signal as the new signal to enter long via SOXL. 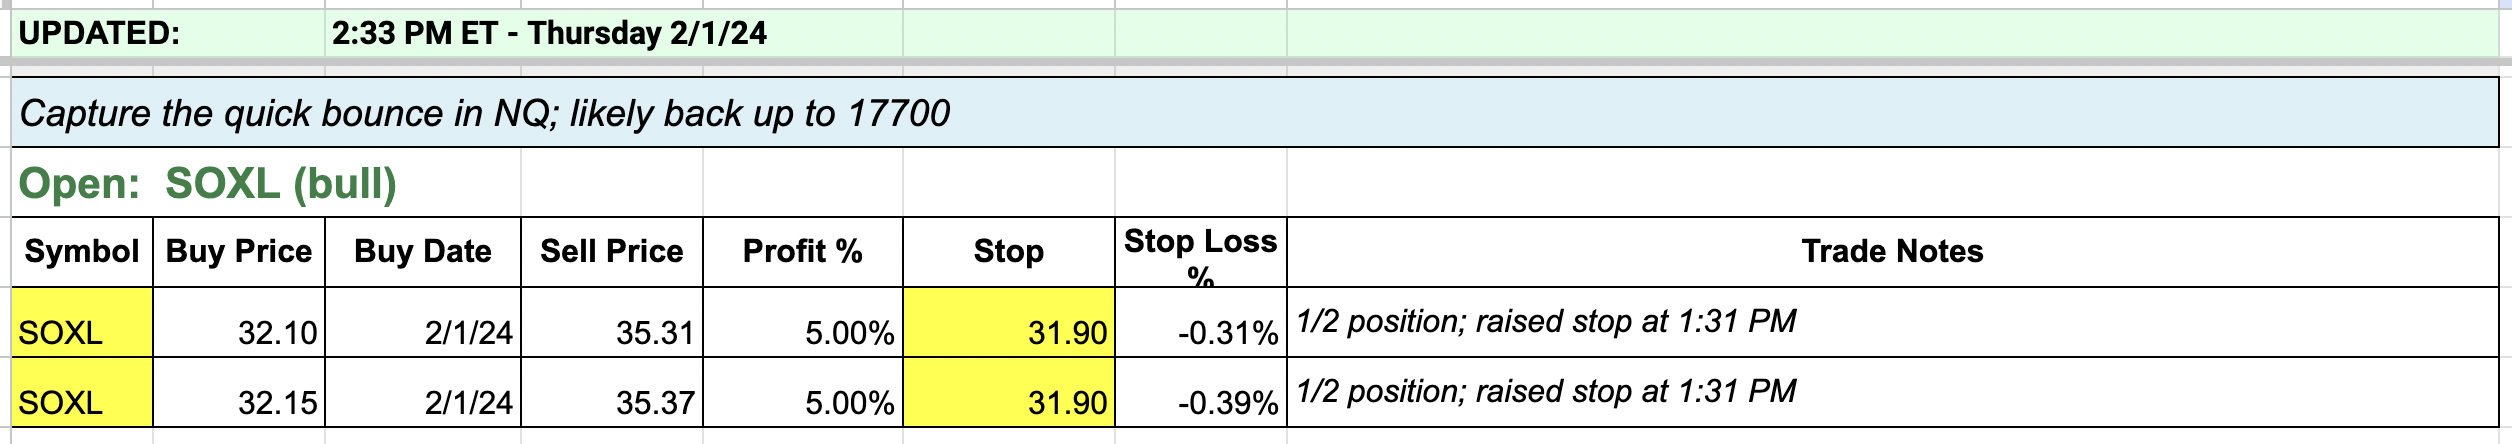 Updates 2:35 AM ET - Thursday Upcoming key events The Fed feels it will be appropriate to begin cutting rates some time later this year. But first they need more evident that inflation will continue to drop and eventually get back to 2%. For now rates remain unchanged and QT remains unchanged. QRA was a non-event. Read more about rates and the economy here. 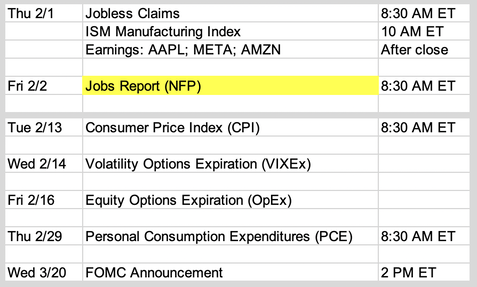 Big picture: bull market; short term: weakening momentum The indicators are still sending out the same message. This is a bull market with weakening momentum, with more selling than buying right now. However the indicators are not showing that this is the start of a bear market. So at some point soon the strong momentum should resume, just not this week. S&P and Nasdaq Advance-Decline Percents (Stockcharts $SPX ADP $NDXADP) are both showing lower high topping patterns on their daily chart. This declining market breadth is now reflected in declining price for ES NQ RTY. VIX daily chart below shows its 20-day EMA blue line about to rise above its 50-day EMA red line. This will likely push VIX up to 16, possibly 17. This supports the current sell mode for ES NQ RTY. 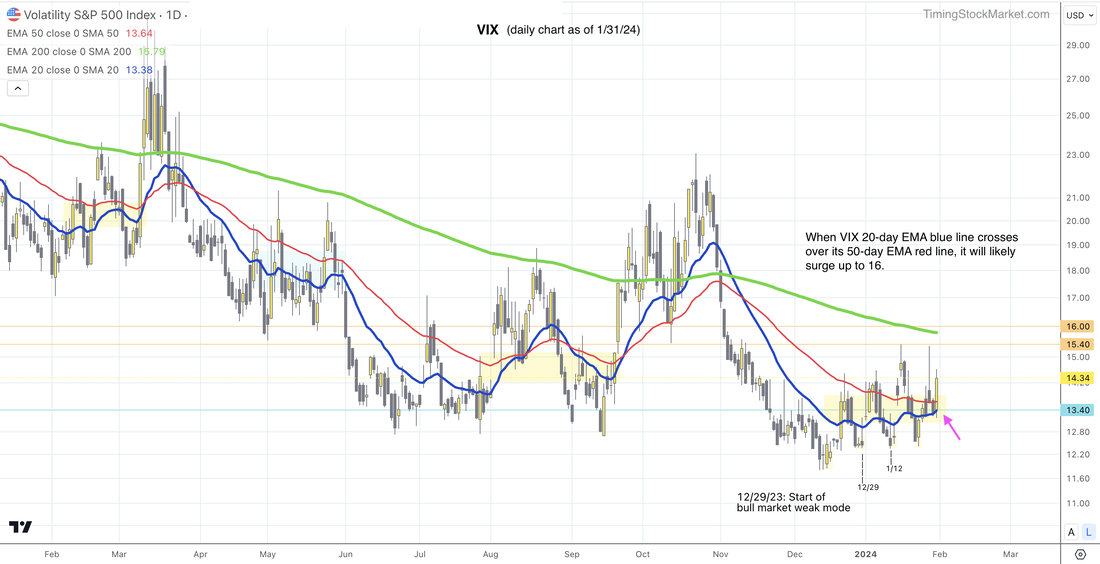 Key S/R levels NQ: NQ did not tag any key resistance levels on Wednesday. Instead it dropped sharply after FOMC. While NQ may quickly tag 17450 on Thursday, it is likely to keep dropping, down to 17000 by Friday. Then we may see some basing at that level, followed by a bounce from there back up to 17800 next week. ES: Similar to NQ, ES did not tag its Jan 29 high on Wednesday. Instead it dropped sharply after FOMC. While ES may quickly tag 4905 on Thursday, it is likely to keep dropping, down to 4820 by Friday. Then we may see some basing at that level, followed by a bounce from there back up to 4954 next week. RTY: RTY did manage to get close to its Jan 29 high on Wednesday after FOMC. Then it dropped sharply. While RTY may quickly tag 1990 on Thursday, it is likely to keep dropping, down to 1925 by Friday. Then we may see some basing at that level, followed by a bounce from there back up to 2025 next week. Our personal trade plan We scaled into half SQQQ position, with plans to add the remainng half at open on Thursday. See updated positions and buy target here. Disclaimer The information presented here is our own personal opinion. Consider it as food for thought. We are not offering financial advice. We are not promoting any financial products. We are not registered financial advisers or licensed brokers. We make no guarantee that anything will unfold according to our projections. You are proceeding at your own risk if you follow our trades.
Updates 1:30 AM ET - Friday Upcoming key events Jobs report is likely to bring about a relief bounce for ES NQ RTY. Read more economic analysis here. 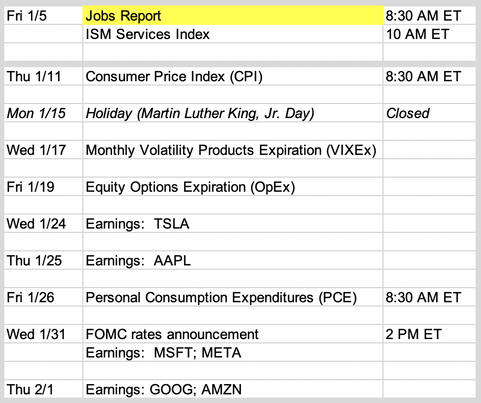 Key S/R levels Most levels have been lowered to reflect the scope of the selloff. 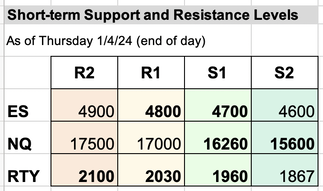 Expect a moderate selloff after a quick bounce to retest R1 In the big picture context, current market is still in a bull trend. However, as we've been sharing with you, ES NQ RTY are starting a moderate selloff, a big dip within the bull trend. ES NQ RTY have been dropping since Dec 29, and are rapidly approaching the new lower S1 levels. After 5 days of selling, they are likely to bounce back up to retest resistance at the new R1. The job report may provide the catalyst for this bounce. The bounce is unlikely to last for very long. ES NQ RTY are unlikely to rise above resistance at R1. After that ES NQ RTY are very likely to resume the drop, which may go all the way to support level at S2. This selloff is likely to last until after FOMC on January 31. After that we are likely to see the big-picture bull trend resumes. How did we arrive at this projection? Based on the indicators below. Market breadth has dropped sharply We've been sharing with you about McClellan Oscillator (Stockcharts.com $NYMO) which measures market breadth. We wrote that once this oscillator turns negative, it will launch a selloff period. This oscillator has dropped to below zero since Jan 2, and has been dropping sharply since. This indicates that selling momentum has picked up substantially, and market is now in a moderate selloff period. The sell period typically lasts from 3 to 6 weeks, as highlighted in yellow below. This is why we project that the current sell period will likely last until FOMC on January 31. 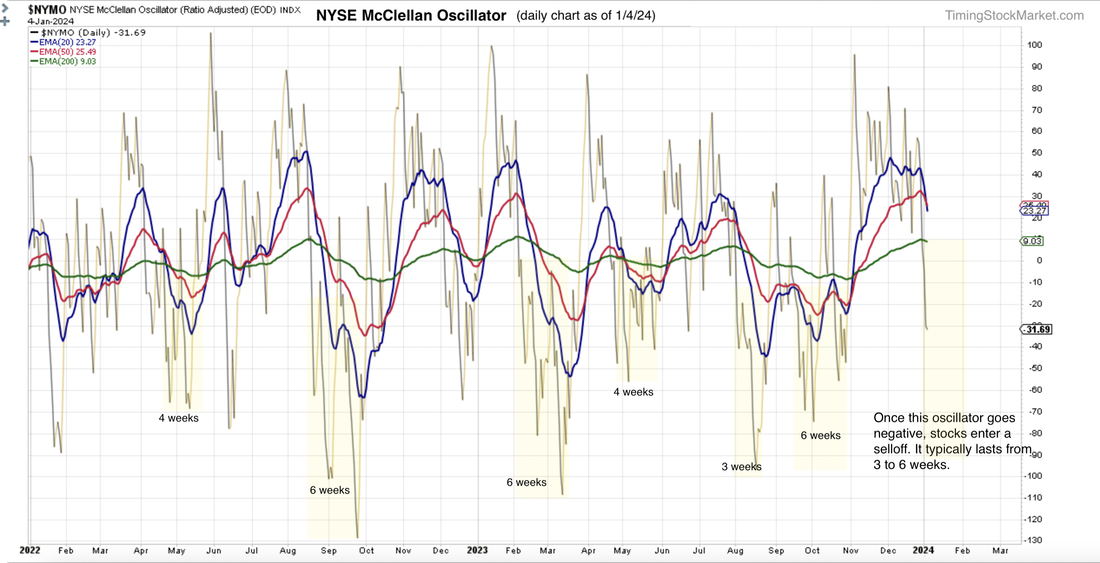 VIX VVIX and VIX futures are all rising VIX VVIX and VIX futures intraday charts have formed W bottom patterns. They are all rising in a tightly coiling pattern, indicating more selling is to come. VIX may dip a bit while ES NQ RTY bounce, but it will resume the climb and will pick up speed once ES NQ RTY reach resistance at R1. If VIX spikes up to the zone 16 - 16.5, ES NQ RTY are likely to drop all the way down to support at S2. Rate rises as junk bonds formed a top 10-year Treasury yield (US10Y) has been rising since Dec 27. Junk bonds (JNK) has been forming a clear top on its daily chart. They confirm the selloff. Our personal trade plan VIX has been coiling too much, making it difficult to successfully trade UVXY. So we have new buy orders to enter TZA instead to capture the selloff. We want to capture the drop in RTY from 2030 (R1) to 1867 (S2) Click here for Signal Trades spreadsheet. Disclaimer The information presented here is our own personal opinion. Consider it as food for thought. We are not offering financial advice. We are not promoting any financial products. We are not registered financial advisers or licensed brokers. We make no guarantee that anything will unfold according to our projections. You are proceeding at your own risk if you follow our trades.
Updates 4:00 PM ET - Thursday Exited SVIX We wanted to capture VIX dropping from 14.49 down to 11.8. So we entered SVIX on Friday Dec 22. This is a quick bull trade and with UVXY rising ahead of the holiday, we decided to lock in our profit. 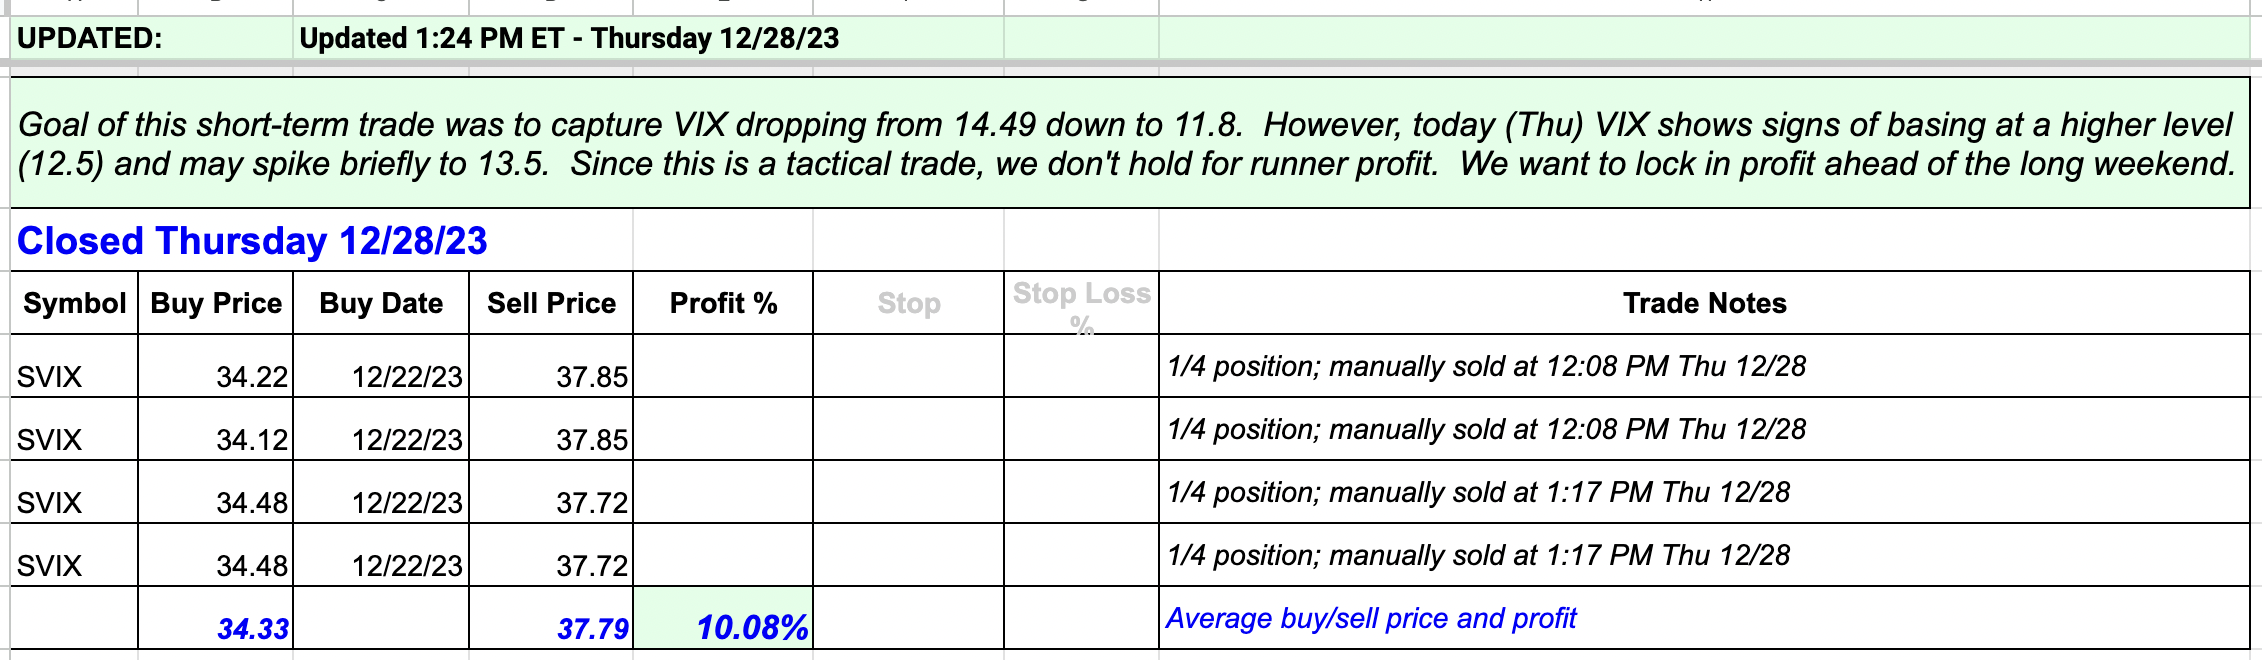 Updates 1:00 PM ET - Thursday Upcoming key events 2023 is coming to an end. It's time to focus on January. Note that we've added the earnings dates of the Magnificent 7 stocks to the calendar below. The second half of January will have a lot of fireworks. Read more economic analysis here. 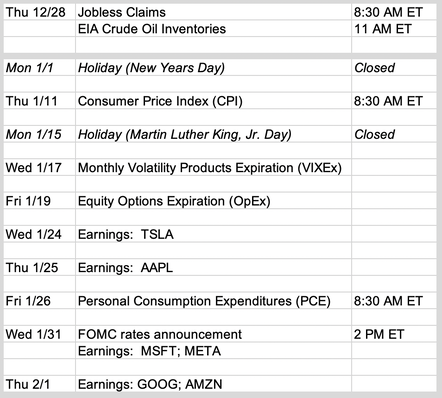 Key S/R levels All levels are still the same. 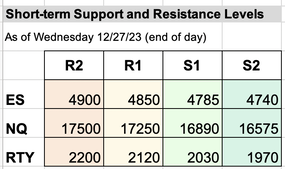 All indicators still support the bulls
We expect the current bullishness to last into the early part of next week, which is the start of January. Expect VIX swings in January Keep an eye on VIX as it is the leading indicator. We expect to see VIX drops to 11.8, then bases at this level for multiple days during the first week of January. ES NQ RTY are likely to rise and may reach resistance at R1 while VIX does this. Once we enter the second half of January, we are likely to see VIX rise again, and it may rise as high as 15.5 in this second attempt. Once VIX starts to rise again, ES NQ RTY will likely retest support at S1. If VIX manages to rise up to 15.5, then ES NQ RTY will likely retest support at S2. Our personal trade plan As we wrote on Fri Dec 22, we entered SVIX Fri morning to capture VIX dropping from 14.49 down to 11.8. If VIX anchors at 11.8 and then starts to rise, we'll aim to capture the rise in VIX from 11.8 to 15.5 with UVXY. Click here for Signal Trades spreadsheet. Disclaimer The information presented here is our own personal opinion. Consider it as food for thought. We are not offering financial advice. We are not promoting any financial products. We are not registered financial advisers or licensed brokers. We make no guarantee that anything will unfold according to our projections. You are proceeding at your own risk if you follow our trades. |
Archives
July 2024
Categories |
 RSS Feed
|
|
Copyright (c) 2019-2024 LOOK Systems LLC
All rights reserved. |