Updates 12:45 AM ET - Monday 8/1/22 Upcoming key events This is week is all about jobs. 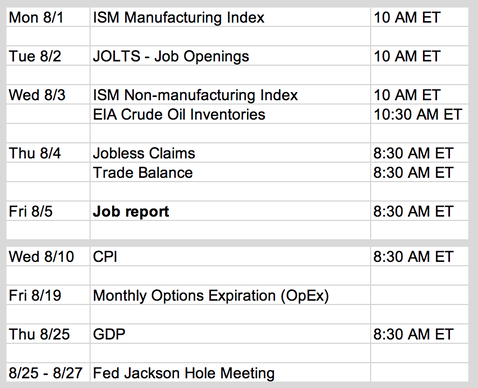 Earnings this week Chart courtesy of Earnings Whispers. 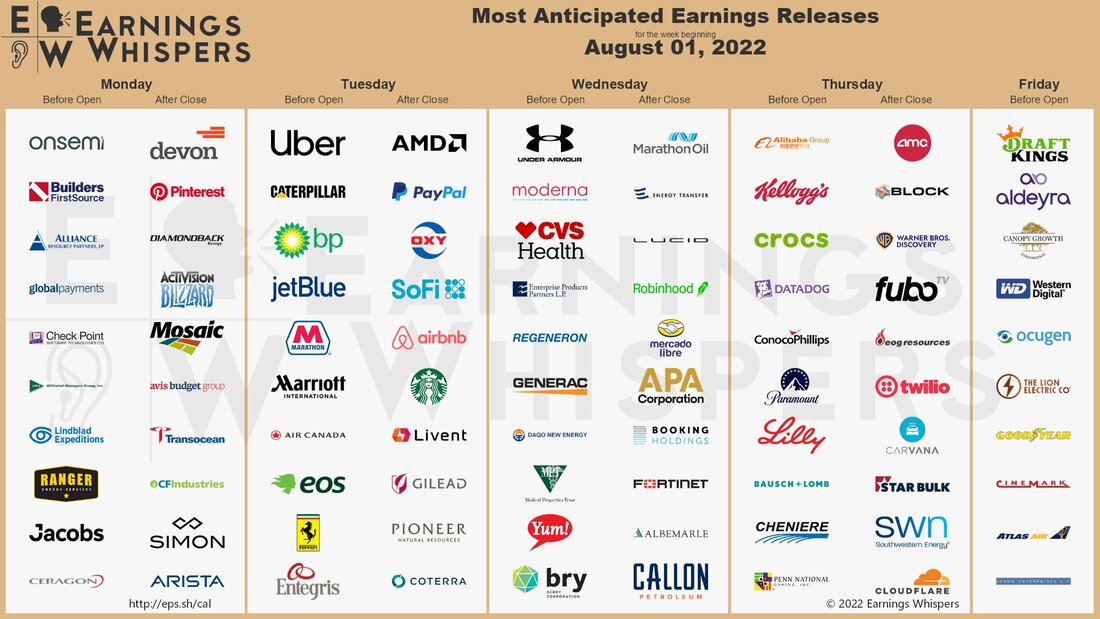 The big picture: still gloomy fundamentals
The only source of strength in the current economy is the labor market. The job report this week will give us a better idea of where jobs are heading. ...but squeeze, baby! As we explained on Friday, despite a very gloomy economy, the market is turning bullish basically on the bond market betting that the Fed will cut rates in the 2nd half of 2023. And because of the dominance role of equity hedging via the options market (puts), any hint of bullishness in price actions can quickly trigger a short squeeze due to short covering by traders and massive short covering by dealers. It's very difficult to trade this market if your trade criteria are driven by fundamentals. Bears betting against the current price actions may get squeezed hard. But bulls also need to be careful. The rate cuts in 2023 may just turned out to be a bond market fantasy. And any hints of this not happening will trigger a massive sell-off, in both bonds and equities. Bear market rally that might become bull market If we focus on actual price actions, the charts right now are saying "bullish, bullish, bullish!" Take a look at ES 4-hour chart below. We want to suggest to you that it is entirely possible that a new bull market has started on 7/19/22. This is when the 20 EMA blue line rose above 200 EMA green line. More importantly the 200 EMA green line also flattened out and started to rise. So while traders may be foolishly bullish right now, we don't want to argue with a rising 200 EMA line on a higher time frame like a 4-hour chart. We just want to ride it up. 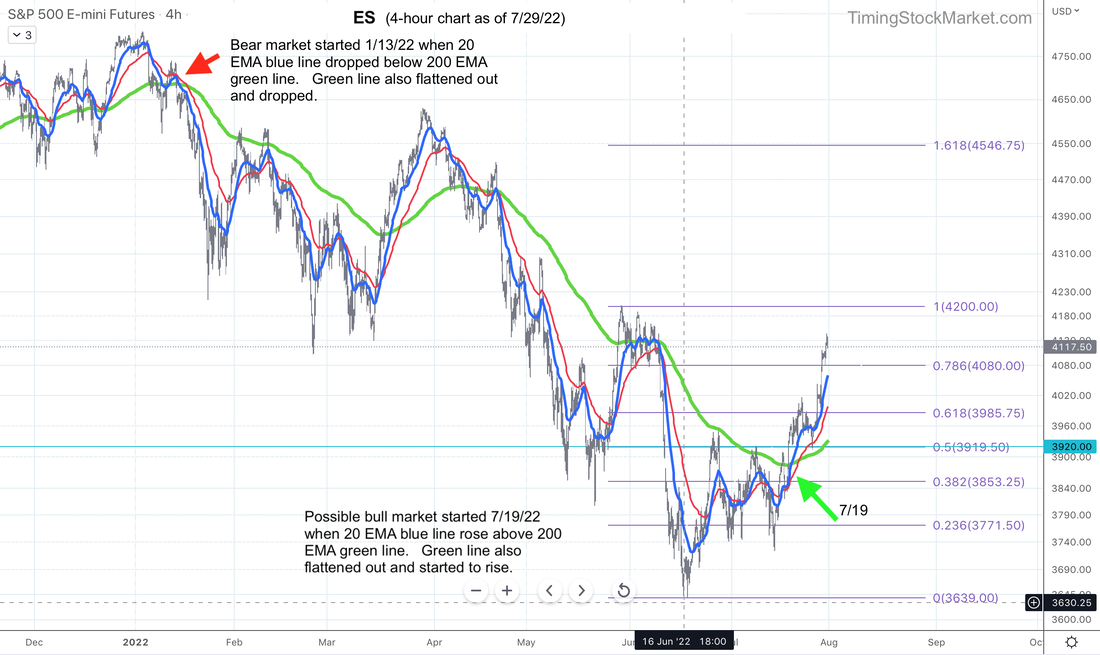 Market breadth confirms bullishness 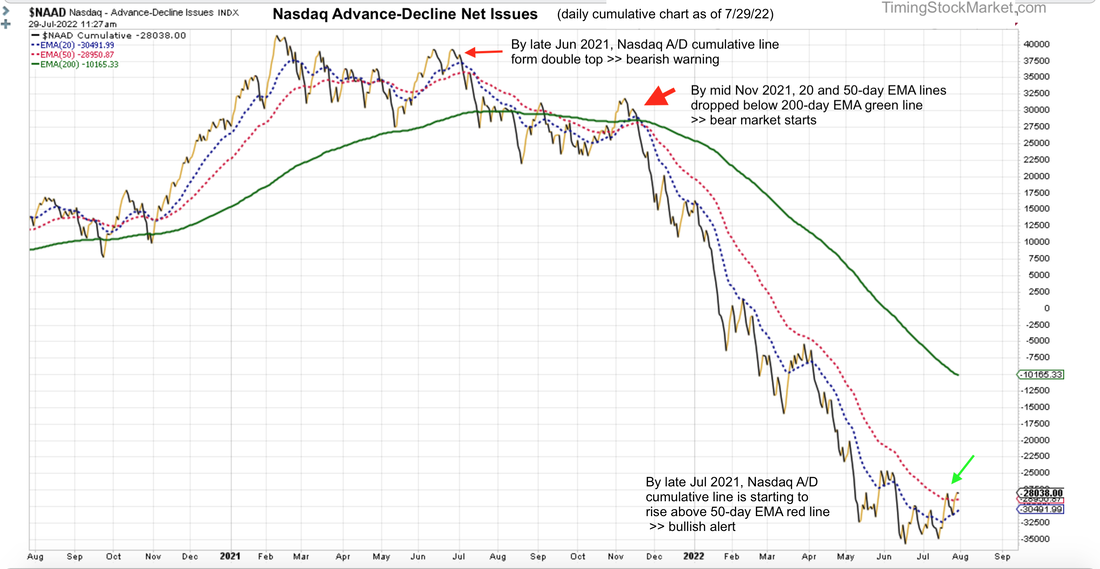 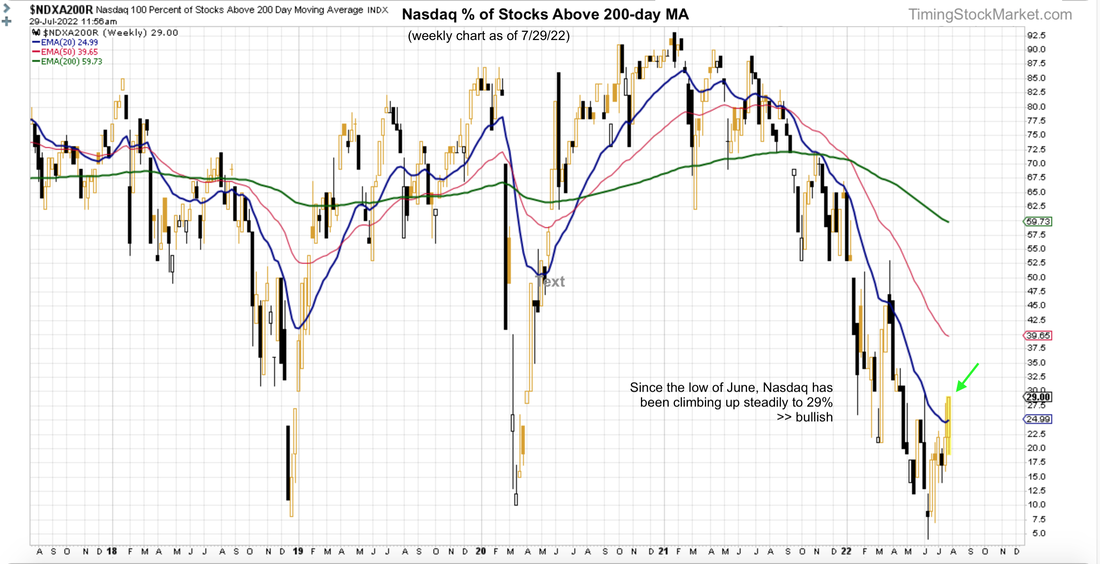 Volatility confirms bullishness While ES NQ RTY 200 EMA green lines (4-hour charts) are rising, $VIX $VVIX 200 EMA green lines are dropping. In fact, they've been doing this since 5/20, but nobody believed their bullish message. 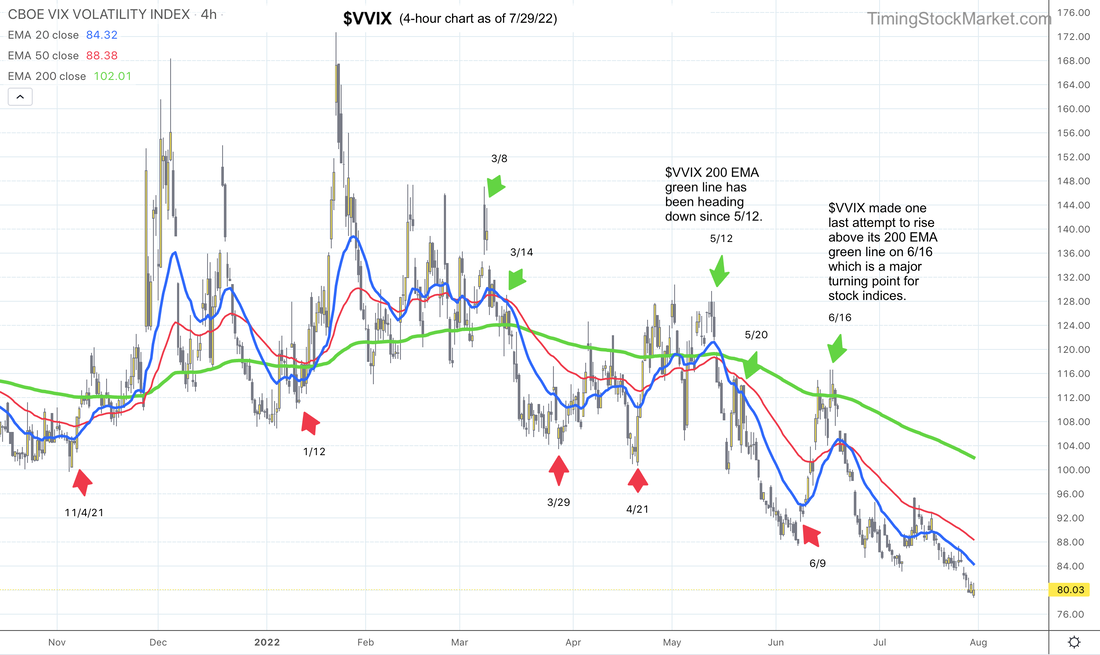 Trade plan Click here for live trades. Subscribe to get our latest analysis, daily trade plans and live intraday trades. Current trade record here. Disclaimer The information presented here is our own personal opinion. Consider it as food for thought. We are not offering financial advice. We are not promoting any financial products. We are not registered financial advisers or licensed brokers. We make no guarantee that anything will unfold according to our projections. You are proceeding at your own risk if you follow our trades.
0 Comments
Updates 1:00 AM ET - Monday 7/25/22 Upcoming key events This is a big week in economic news, but the event with the most power to move the market is FOMC rate announcement on Wednesday. 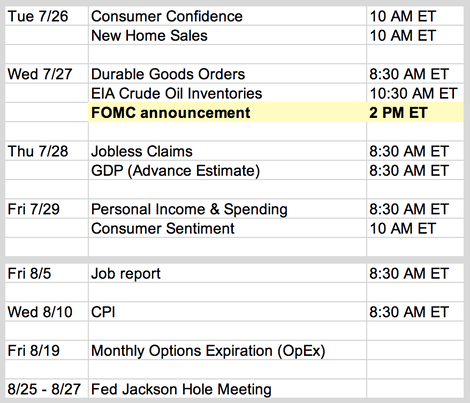 The big picture: still gloomy fundamentals
So is the bear market rally done? The current bear market rally that started on 6/16 was fueled primarily by three factors:
As we discussed in Friday's post, the short-covering activities that functioned as fuel for the rally since 6/16 has been mostly burned off. The short-term bullish volatility signal is starting to fade. The market is now vulnerable to the effect of economic news since it's not as well hedged yet as it was before 7/15. There are a lot of triggering news this week, along with the big one which is FOMC rate announcement on Wednesday. So we should expect big price swings, potentially both up and down. Speaking of FOMC, the Fed is expected to raise rate by 0.75 percentage point on Wednesday. (They usually float their numbers to the Wall Street Journal.) The market has already priced this in. It is the hints of how much longer does the Fed expect to keep raising rates that will matter more to the market at this point. Market breadth
Taken together, waning breadth is usually a bearish warning. Short-term volatility signal: "Fading Bull" (close to becomimg "Rising Bear") $VVIX 2-hour chart below continues to form a W bottom with its 20 EMA blue line. These W bottoms typically precede a big rise in volatility (red arrows). This is a warning from $VVIX that the bullish force is fading. 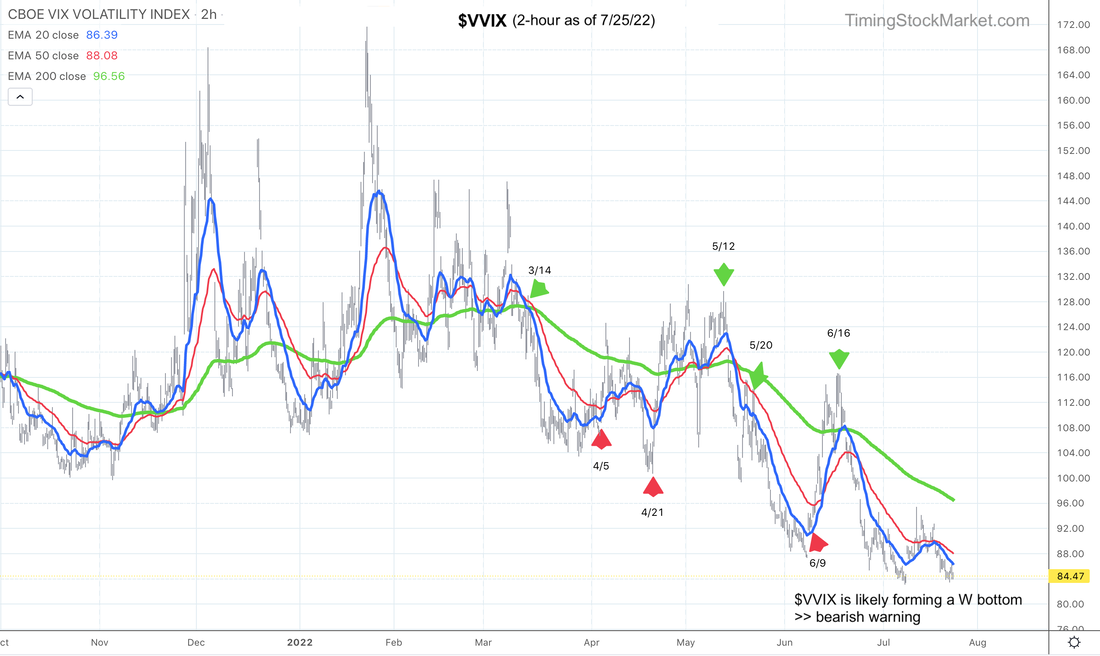 To be clear though, $VIX itself has not risen up enough yet. It is still below its 20 EMA blue line in the 4-hour chart below. 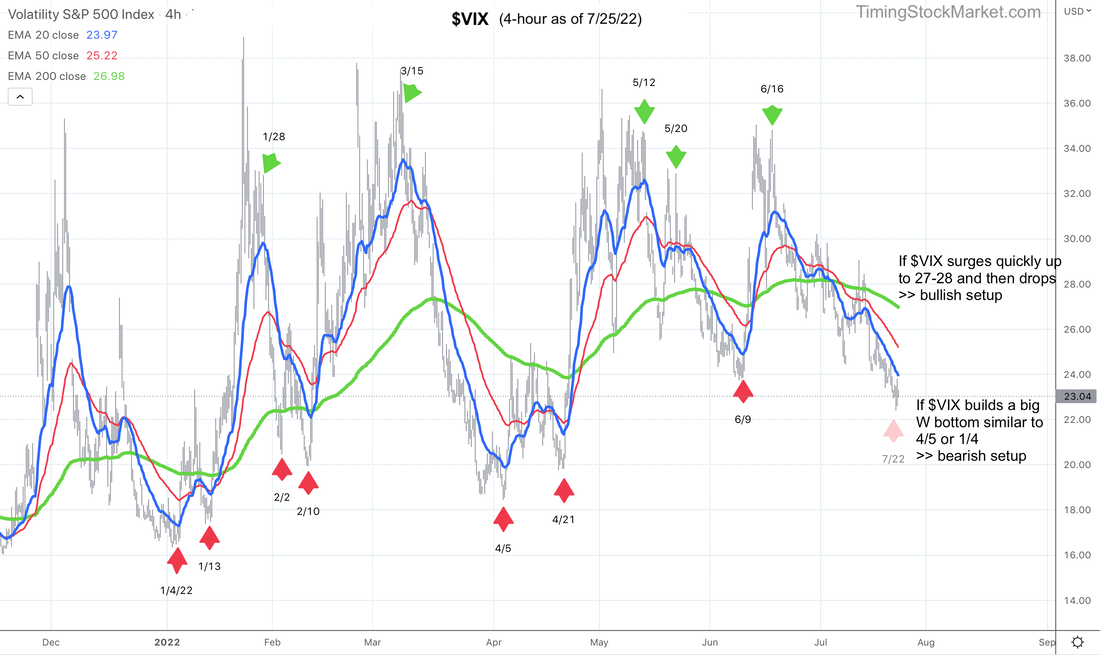 What would turn the signal to "Strong Bull" again? If $VVIX quickly spikes up from here to about 103, and $VIX spikes up to about 27, and then they both drop quickly, the setup would recharge the bull again. During the quick $VVIX $VIX spike, prices may retrace to these key levels:
These are potentially bullish setups, and ES may rise from 3800 all the way to 4200 (high 5/30). What would turn the signal to "Rising Bear"? If $VVIX and $VIX spend a few days building a bigger W or multiple W bottom, then conditions will be turning seriously bearish. $VVIX $VIX may rise a lot higher. In that scenario, ES NQ RTY are likely to retest the lows of 6/16. 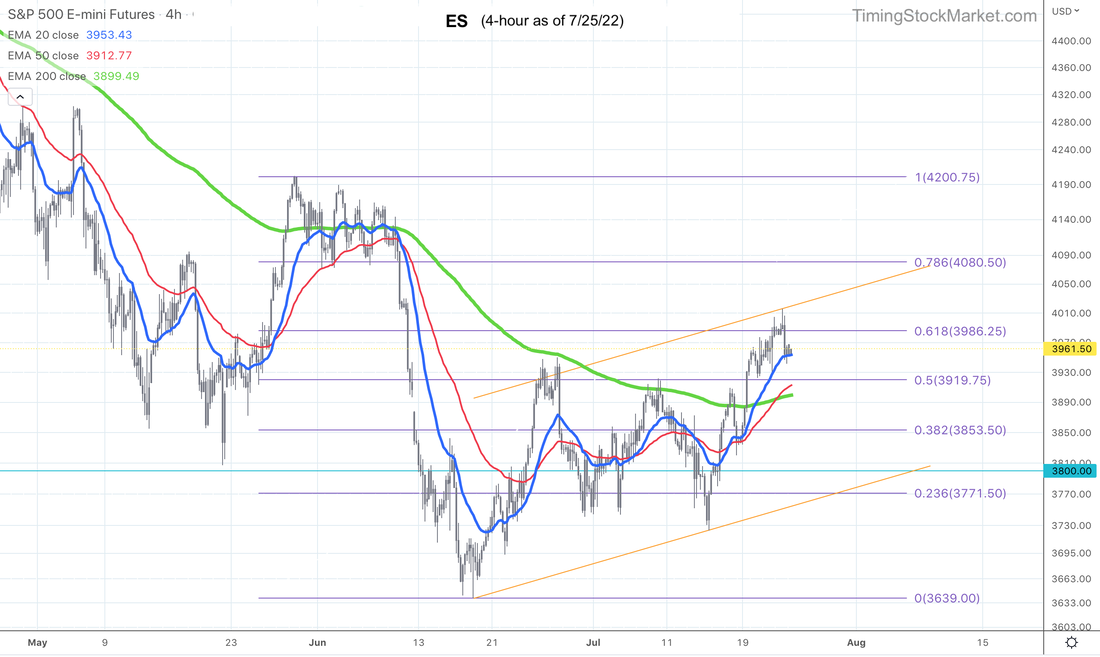 Trade plan Click here for live trades. Subscribe to get our latest analysis, daily trade plans and live intraday trades. Current trade record here. Disclaimer The information presented here is our own personal opinion. Consider it as food for thought. We are not offering financial advice. We are not promoting any financial products. We are not registered financial advisers or licensed brokers. We make no guarantee that anything will unfold according to our projections. You are proceeding at your own risk if you follow our trades.
Updates 10:45 AM ET - Sunday Upcoming key events This week is lighter in economic news. 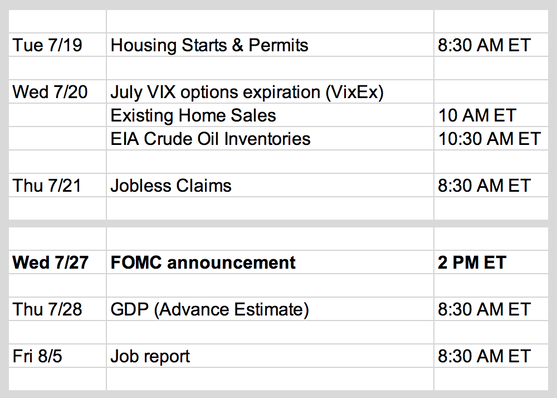 Important earnings this week: 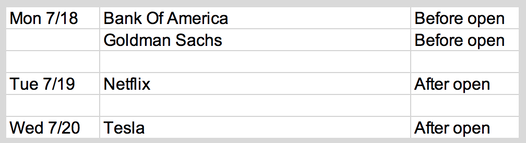 The big picture: gloomy fundamentals
Short-term volatility signal: "Rising Bull" Yet weirdly enough, stock volatility continues to drop. $VIX weekly chart below shows it has been forming a series of lower high tops for the last 6 weeks. This has been providing bullish tailwind for $SPX. $VIX may drop all the way to its 200-week EMA green line (currently at 21.5) before a much bigger bounce. This means more short-term bullish tailwind for $SPX. 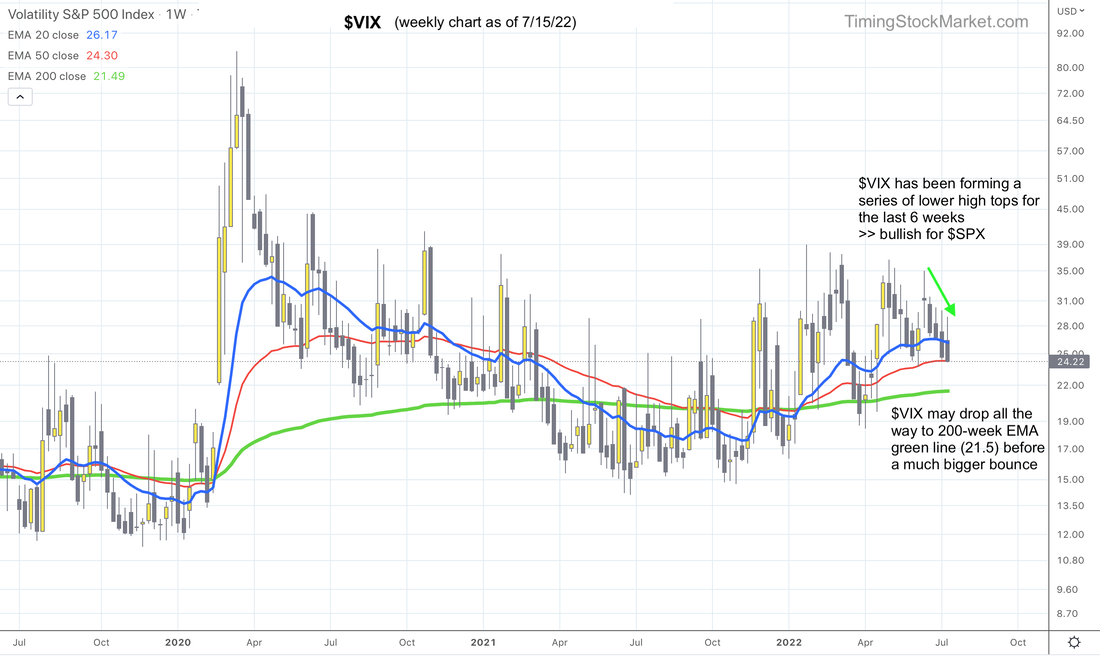 Market breadth: providing bullish tailwind for stocks
Stock indices may be coiling to break out In looking at Nasdaq futures NQ 4-hour chart below, it is now clearer that NQ has been bullish since 6/16 low. And since that low, NQ has been coiling to form a base, as evident in the patterns of its 20 EMA blue line and 50 EMA red line. There is a high probability that this coiling base will result in a breakout, most likely post FOMC next Wednesday 7/27. The breakout may push price back up to the highs of 6/2. This is true for NQ as well as ES and RTY. 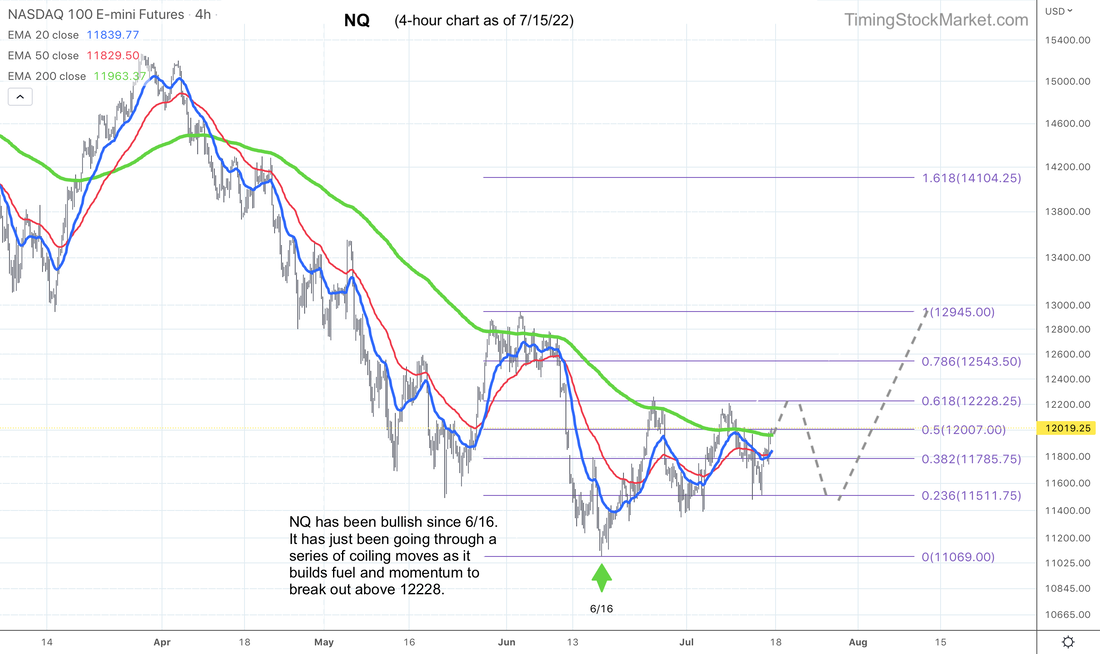 Trade plan Click here for live trades. Subscribe to get our latest analysis, daily trade plans and live intraday trades. Current trade record here. Disclaimer The information presented here is our own personal opinion. Consider it as food for thought. We are not offering financial advice. We are not promoting any financial products. We are not registered financial advisers or licensed brokers. We make no guarantee that anything will unfold according to our projections. You are proceeding at your own risk if you follow our trades.
Updates 9:22 AM ET - Wednesday 7/6/22 ISM Service Report and FOMC Minutes
Updates 11:30 PM ET - Tuesday Short-term volatility signal: "Transition" When we last posted at 2 PM on Tuesday, stock indices were still not fully revealing their directions yet. But by end of day Tuesday, price actions and chart patterns swung in the bullish direction. So how real is this? $VIX daily chart below shows that it has been forming a lower high pattern relative to the highs of mid-June. Tuesday pattern confirms that volatility continues to ebb. This provides bullish tailwinds for stocks. 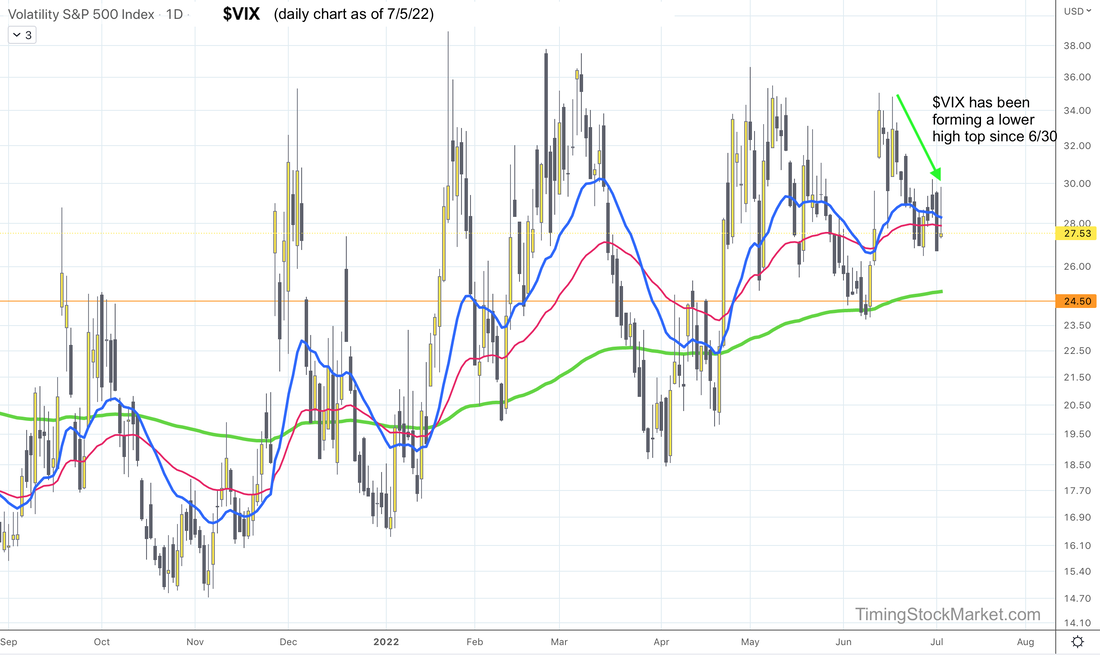 SVXY chart also gave us a substantial clue. Observe the sideway 20 and 50 EMA blue and red lines on SVXY 2-hour chart below. The last time SVXY formed this pattern was 5/24, right before it broke out. 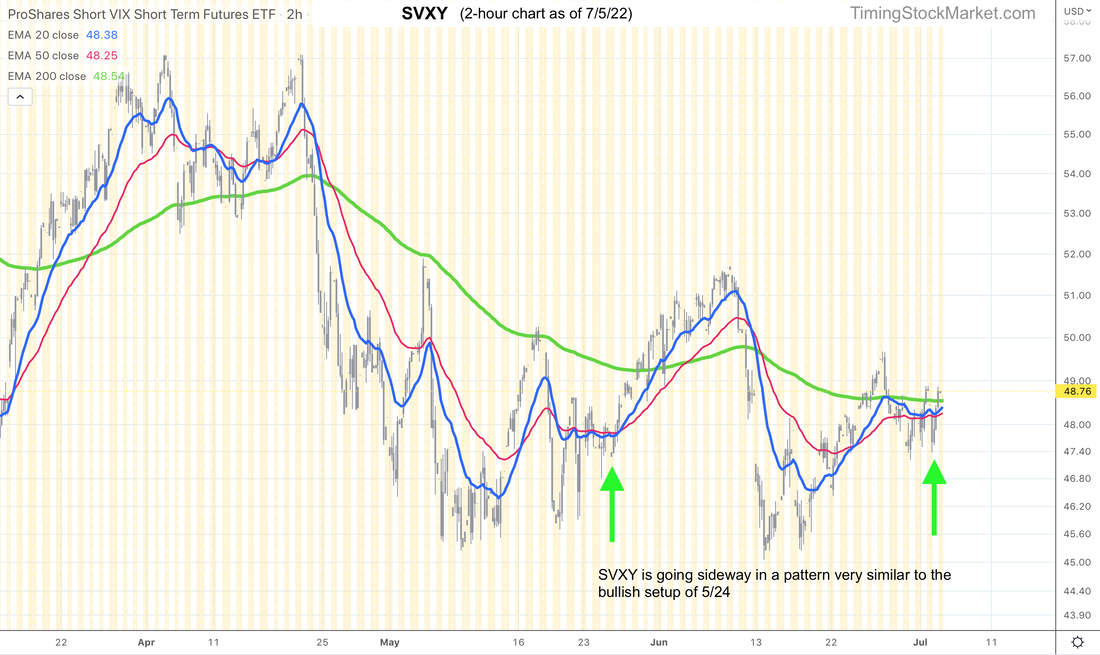 Nasdaq is the most bullish index right now (who knew) Nasdaq Advance-Decline net issues are climbing back up. NQ $NDX price actions were much more bullish on Tuesday than S&P or small caps. This happened despite the major sell-off in semiconductor stocks (SOXL). So what can we expect to see from NQ chart? NQ 4-hour chart below shows that it is forming a potential W bottom. As long as NQ stays above the support level of 11350 on Wednesday, it turns the signal to "Fully Bullish". Once NQ starts rising, the first level of resistance is at the 200 EMA green line, around 12007. If NQ can vault over this line, it has a chance to get back up to 12900. 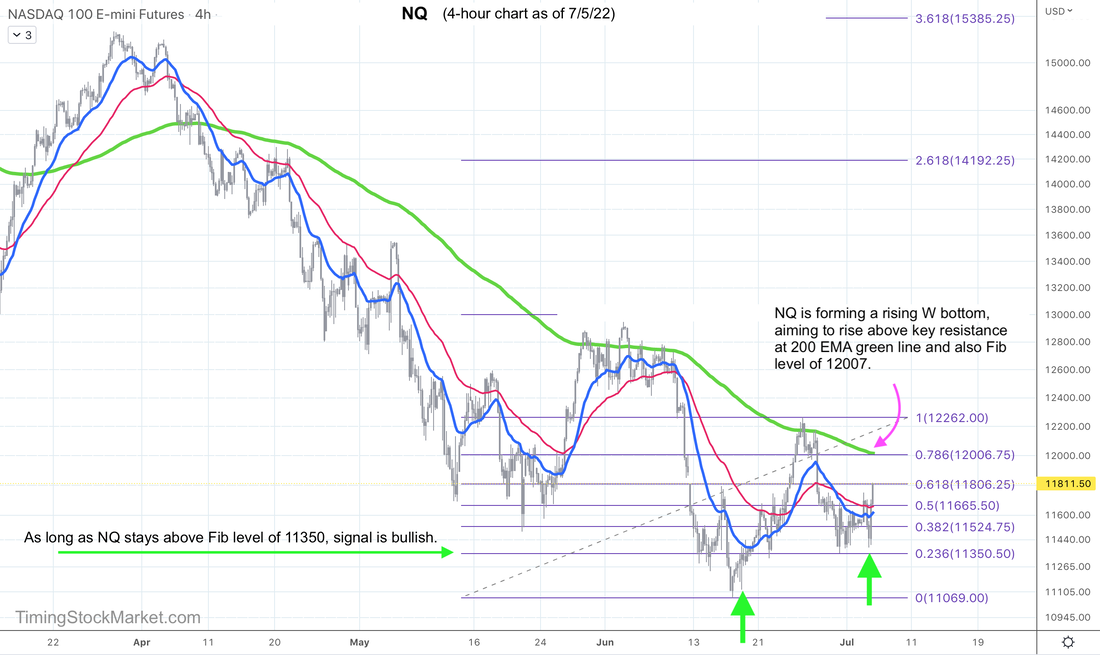 Trade plan Click here for live trades. Subscribe to get our latest analysis, daily trade plans and live intraday trades. Current trade record here. Disclaimer The information presented here is our own personal opinion. Consider it as food for thought. We are not offering financial advice. We are not promoting any financial products. We are not registered financial advisers or licensed brokers. We make no guarantee that anything will unfold according to our projections. You are proceeding at your own risk if you follow our trades. |
Archives
July 2024
Categories |
 RSS Feed
|
|
Copyright (c) 2019-2024 LOOK Systems LLC
All rights reserved. |