|
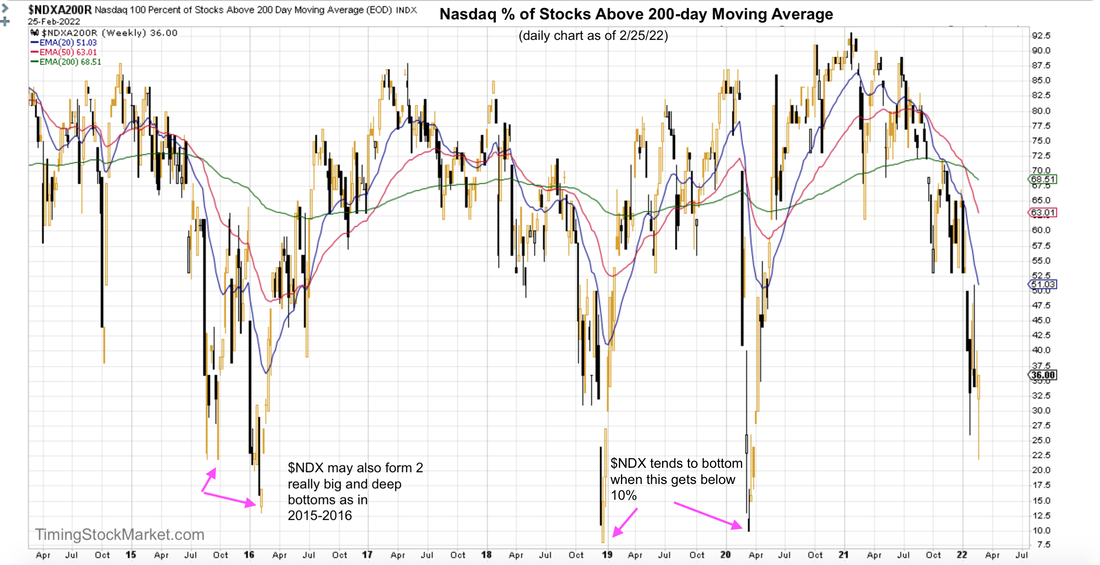
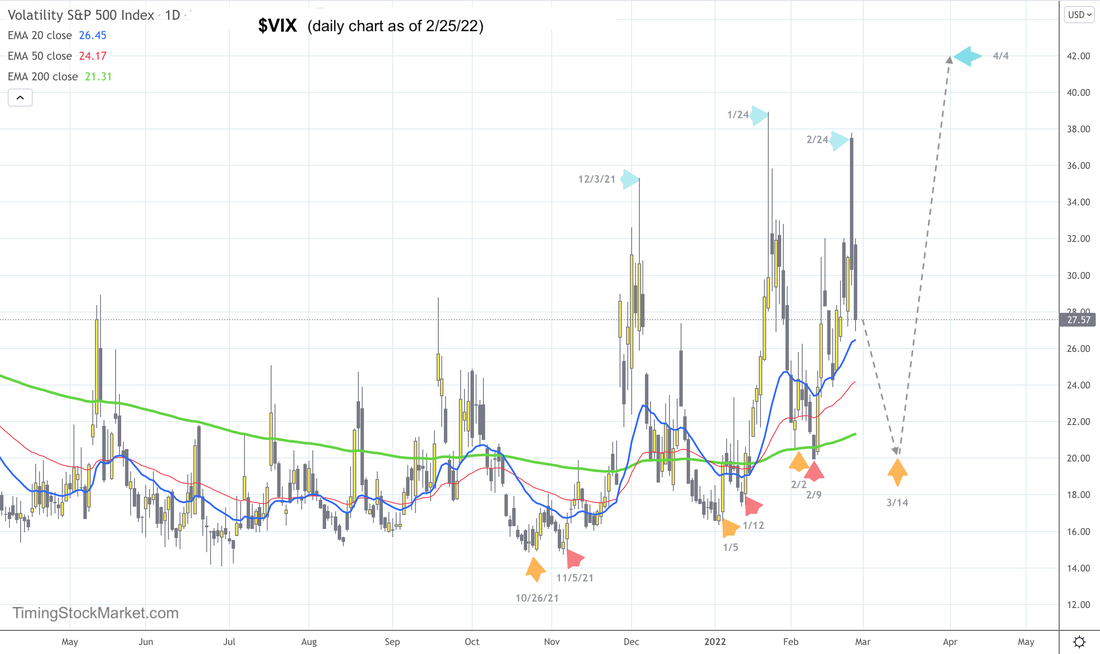
We trade 3x ETFs such as TQQQ TNA SOXL LABU UVXY using proprietary analysis of volatility. Subscribe to get our latest analysis, trade plans and live intraday trades. Current trade record here. Updates 2:15 PM ET - Sunday Big Picture: Has the bear market ended yet? While the bear market rally that started last week helps to ease market anxiety, in the context of the multi-month big picture, market is still in a bearish phase. And it's not done being bearish yet. Here are 3 things to keep an eye on that will tell us when this bear market will bottom. First, we need to see a lot more call buying from traders and fund managers. Last week's massive rally was mostly due to short covering by traders and dealers. These shorts were a result of big demands for hedging puts from traders and fund managers. There's still no sign of increasing demands for calls yet. We don't have a healthy start to a bull market until traders are eagerly buying calls. Second, the percentage of Nasdaq happy stocks (stocks that are above their 200-day MA) should drop to 10% or lower. Or else there should be a huge double bottom as shown in the chart below. Climatic moments in a bear market do not typically arrive at 36%, which is where we are right now. Third, we need to see one more really scary volatility spike. So far we've only had two:
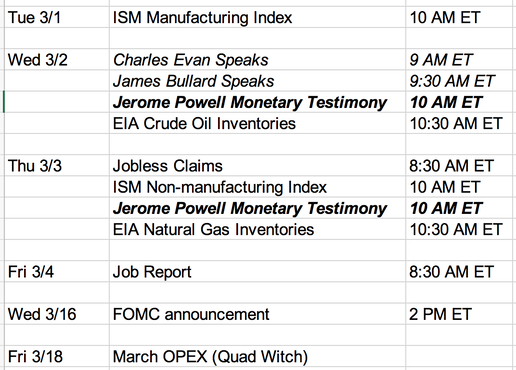
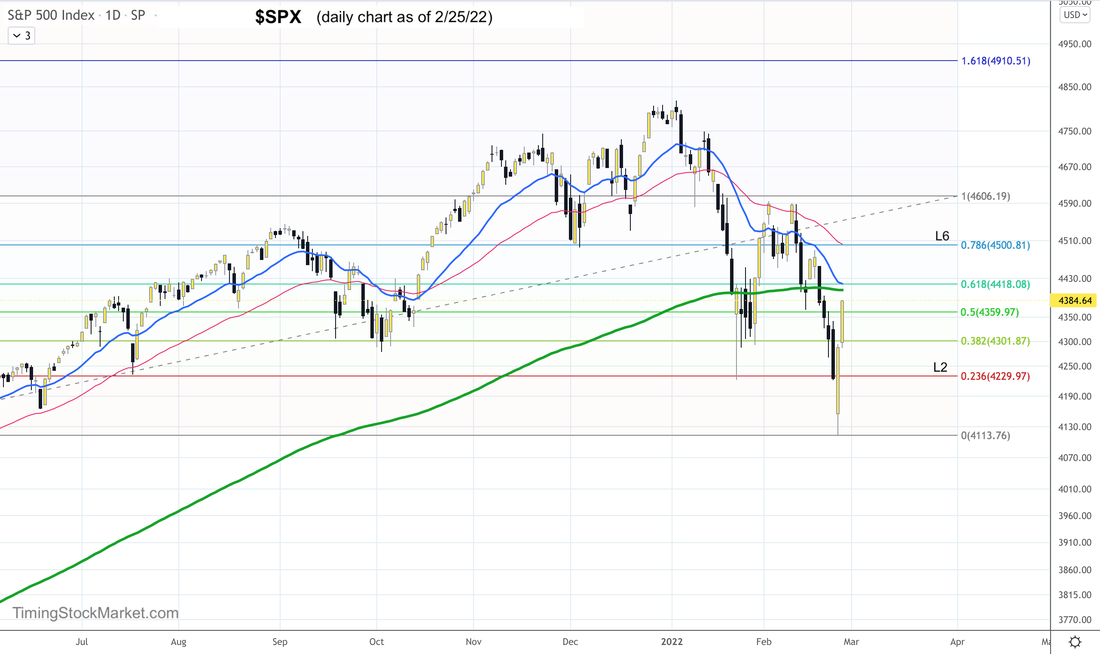
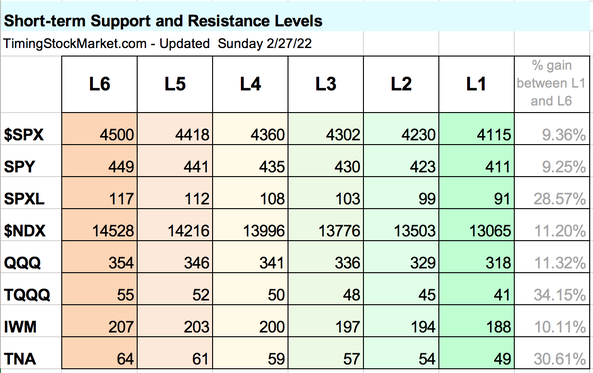
The interim spike between 2/9 and 2/24 does not qualify as the scary peak. We need one more volatility spike that forms a higher high from 1/24 peak. Here is our projection for this 3rd spike in the chart below. (Read more about $VIX $VXN $RVX $VVIX here.) How much lower can market drop to? $SPX 4115 low from last week provides strong short-term support for this week. But ultimately, when the 3rd volatility spike peaks, we may see $SPX bottoms out at 3875. These are our projections, and we may turn out to be dead wrong. In fact, our inner bull really hopes to be wrong about $SPX 3875. But we've been through enough bear market to know that the $SPX at 4115 is not low enough or scary enough to qualify as the bottom. Short Term: Key events this week and next week The key market moving event this week will be Jerome Powell monetary policy testimony to Congress on Wednesday and Thursday. This comes one week before FOMC announcement on 3/16, and sandwiched in between is the job report this Friday. With the Russian sanctions and continuing fighting in Ukraine, a lot of attention may be paid to the oil and gas reports as well. Short Term: Bear market rally to continue this week Looking at $SPX levels as short-term guide posts, we think that $SPX is likely to peak at 4500 prior to FOMC on 3/16. Again, using $SPX levels as guide posts, here are 2 scenarios to look for. Steady: $SPX retests 4230 and then rises up steadily to 4500. Then it chops for a bit before dropping post FOMC. Choppy: $SPX continues to surge quickly up to 4500. Then it spends most of this week and early next week chopping, before dropping post FOMC. Short-term: Key price levels The table below has been fully updated. These are short-term key price levels to help guide your trade plan for this week. Trade plan Click here for live trades. So basically we expect the bear market rally that started last week to continue this week. We want to capture this rally if $SPX $NDX IWM retest L2. See the spreadsheet for TQQQ and TNA rally trades. We will also trade quick intraday positions that are initiated at open, based on futures ES NQ RTY chart patterns formed overnight. These are discretionary trades and we'll post them early if we spy something good. Supplemental data: Trader Hedging (Equity Put/Call ratio) On the daily chart, equity put/call ratio EMA lines are still all rising. This tells us that market participants are still buying and holding on to their puts. Supplemental data: Market Breadth (Advance-Decline net issues) A/D cumulative lines improved substantially for NYSE and Nasdaq and small caps last Thursday and Friday. Still the patterns on these charts are not the typical bear market bottom patterns yet. It is worth noting that small caps actually has the most bullish chart of all. Supplemental data: Hedging by Dealers Read more about how options are impacting the market and the effects of dealer hedging here. Below are the updated volatility trigger levels from Spotgamma.
As of this writing, $NDX IWM have managed to rise above their trigger levels. So we may see calmer price movements this week. However, we have noticed that these trigger levels change rapidly. And in this put-heavy bear market, bullish moods are fragile. Headlines and dealer hedging can still create big whipsaw. Supplemental data: Dark Pool Index (DIX) The good news for the bulls is the Dark Pool Index shows silent money has resumed buying $SPX. They've been at it since 1/25, with some easing early last week. This is a very strong bullish divergence for $SPX. We trade 3x ETFs such as TQQQ TNA SOXL LABU UVXY using proprietary analysis of volatility. Subscribe to get our latest analysis, trade plans and live intraday trades. Current trade record here.
0 Comments
We trade 3x ETFs such as TQQQ TNA SOXL LABU UVXY using proprietary analysis of volatility. Subscribe to get our latest analysis, trade plans and live intraday trades. Current trade record here. Updates 9:15 AM ET - Tuesday 2/22/22 Short-covering rally happening Futures started Monday evening dropping down hard, with ES down close to 1/24 low. But ES NQ RTY all found short-term support and rose substantially overnight. $VIX gapped up big overnight to 1/24 high, but dropped sharply. So is this the end of the bear market? No. This is not capitulation for the big picture market current. That condition is still bearish. The fundamental causes for all this fear has not changed: Fed raising rate, Fed tightening, political tension. What we have this morning is a short-covering rally. As prices rose some amount overnight and $VIX dropped, dealers cover their hedges which were short futures. As a result, price rose rapidly. The short-term volatility-based bearish signal may be peaking for now. It may be transitioning from "Fully Bearish" (last night) to "Tilt Bullish" this morning. We need P/C ratio and A/D line to confirm this. We are not planning to chase price up. Short-covering rally induced by dealers is notorious for rapid big price swings in both directions. Furthermore, switching to a bullish trade right now is going against the big picture bearish current. So we want a stronger short-term bullish signal to help our position. The best setup is for ES NQ RTY to test their overnight lows. That would change the short-term signal to "Fully Bullish" and be more favorable price point to enter long. We'll post updated trade setups shortly. Updates 8:19 PM ET - Monday 2/21/22 Bulls should hope for more immediate fear, not less In our analysis below, we pointed out that the market is currently in a phase where there are 2 bearish forces in effect:
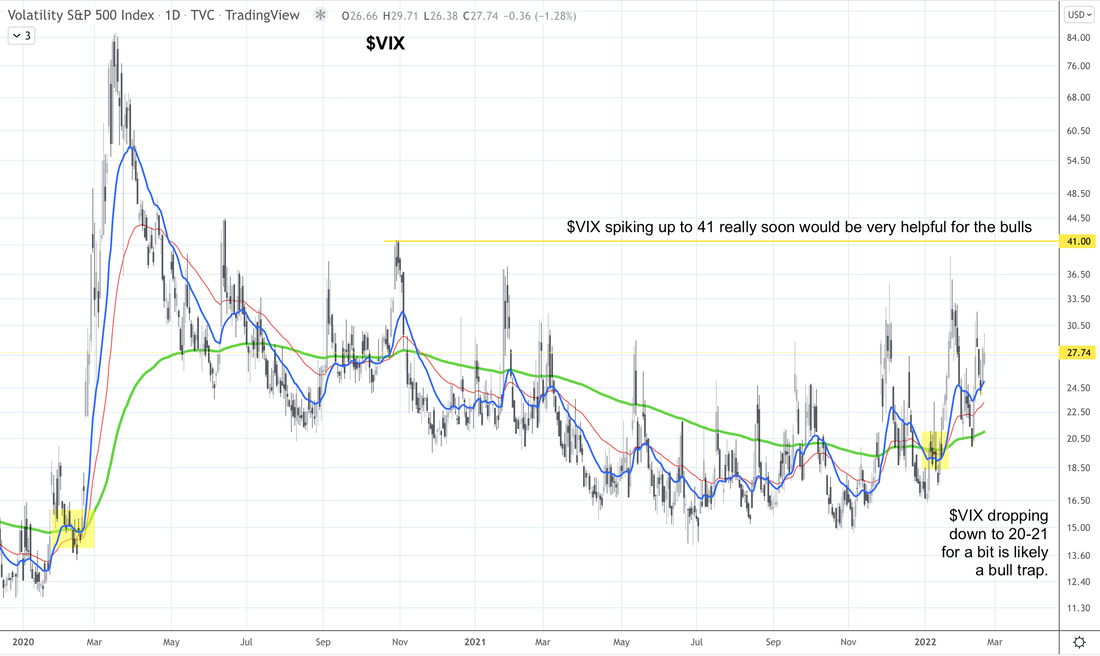
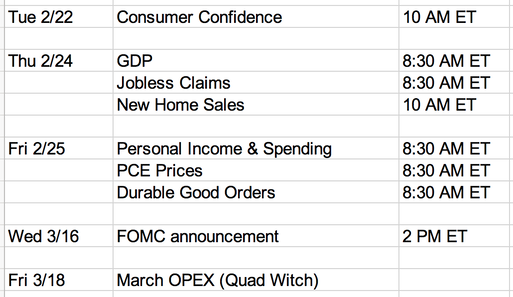
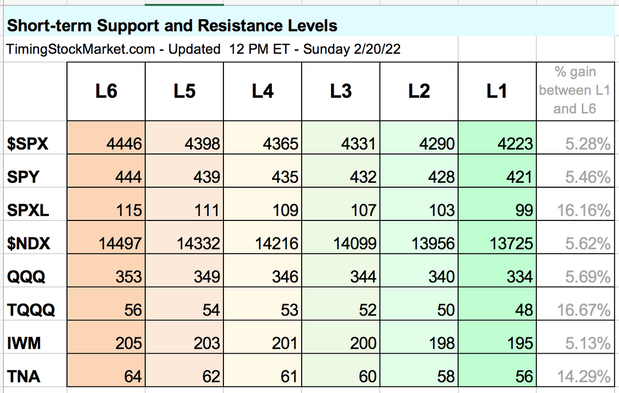
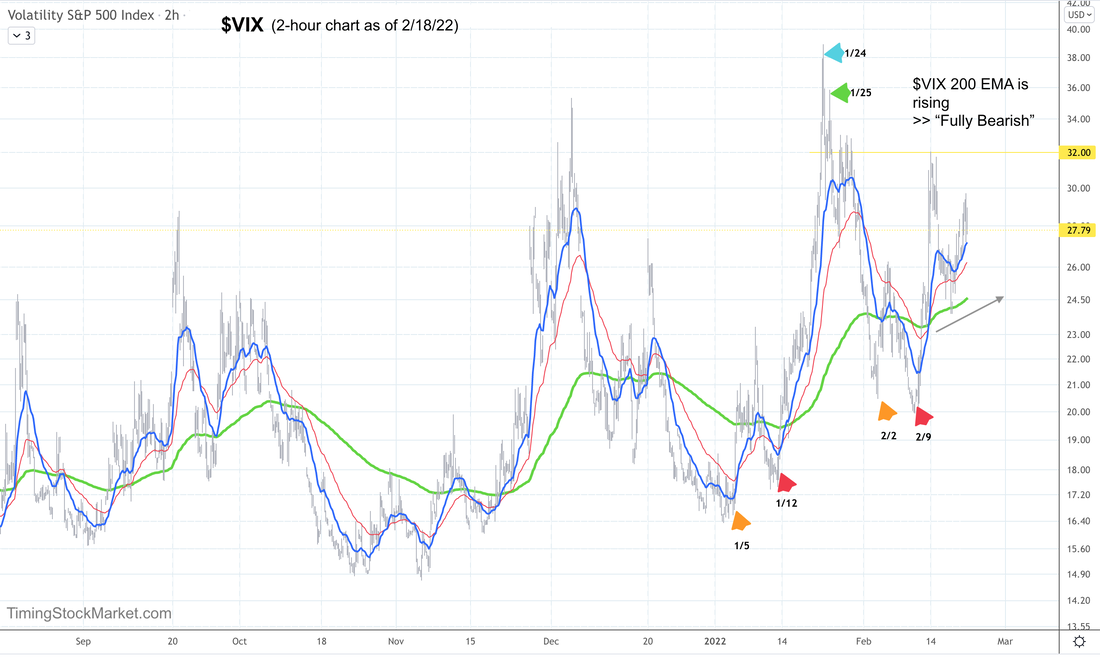
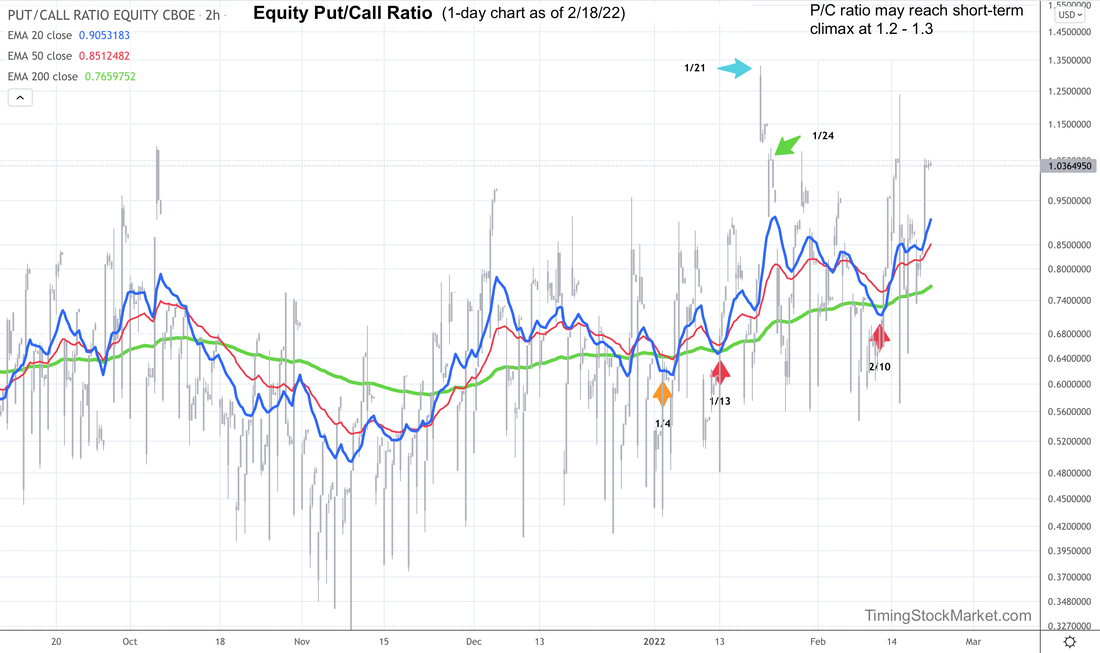
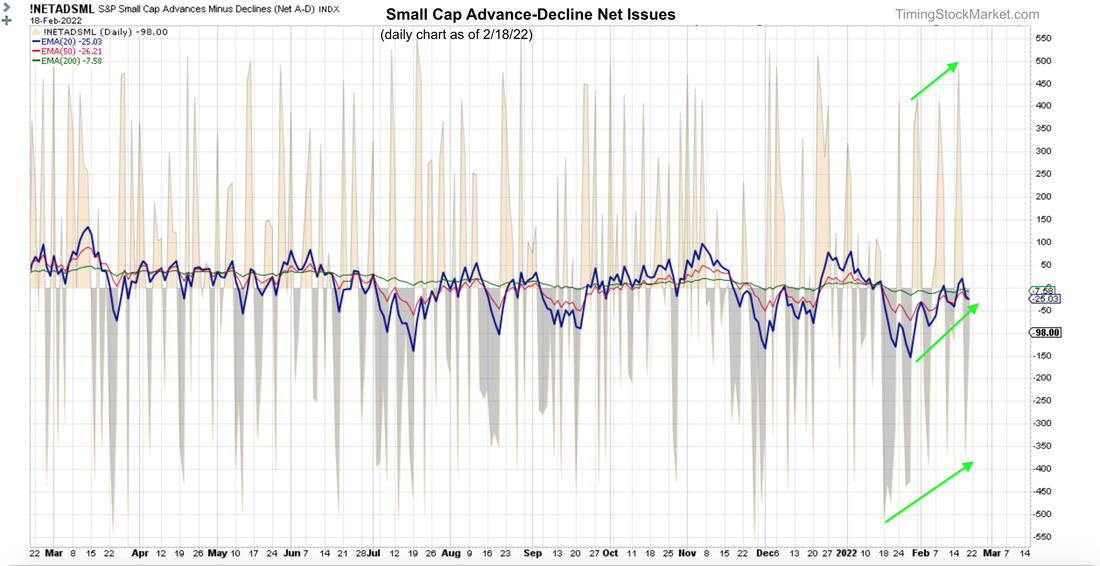
This combination amplifies the overall bearishness. Futures confirmed this bearishness by gapping down hard at open this Monday evening. It's certainly is stomach churning for the bulls. So how do we cope with this? First of all, keep in mind that no bear market lasts forever. If you stick to just trading the major stock indices, you can count on them coming back. We've seen this and traded this in 2008, 2015, 2016, 2018, and 2020. Different styles of bear market: yes. Last forever bear market: no. Recall we also said we're closer to the bottom than to the top. It's a matter of time. And it's a matter of getting most of the participants to panic and throw in the towel. When most of the bulls have sold (and sold at a loss) is when the market typically will turn around. Having said that, we will now say that this bear market is not near capitulation yet. Not enough fear. $VIX daily chart below shows the level of fear that bulls should be rooting for. Unfortunately, fear is not high enough yet. So just be patient. It will get there. Trade plan As we said above, there are 2 bearish forces in effect at the same time right now: big picture and short-term volatility. If futures continue to sell hard tonight, $VIX will shoot up overnight and may peak by 8 AM ET. If we see a big gap up in $VIX and a big gap up in put/call ratio at open on Tuesday, we will monitor for the possibility that the short-term bearish signal has peaked. This short-term bearish signal may then retreat for a couple days. So we may see volatility signal goes from "Fully Bearish" (now) to "Tilt Bullish" by tomorrow. We don't think this is the set up to scale into big bullish positions yet because we would be swimming up stream against the bearish force of the big picture market current. But it may be ok for a small and quick bullish trade via TNA. We'll update more pre-market. Updates 2:30 AM ET - Monday 2/21/22 Upcoming key reports & events Big Picture Market Current: Bearish In the context of the multi-month big picture, market is in a bearish phase and it's not done being bearish yet. Market participants are still feeling highly fearful, as evident in the steadily climbing level of put/call ratio. (See chart discussion further below.) Additionally, the level of "happy stocks" has not dropped low enough yet. By happy stocks we mean stocks currently above their 200-day moving average. For Nasdaq, this level is at 34%. Bear market usually capitulates once this level drops below 10%. Alas we have some distance to go yet. This bear market is not like the 2020 panic that lasted for 1 month. This one is an orderly downward march that goes something like down>up>down>up. This kind of action can be treacherous for traders as it creates traps for both of bulls and bears. But cheer up, bulls. This market is closer to 10% "happy stocks" than it is to being at a vulnerable top. The final drop will be stomach churning, but the worse it feels, the better the bullish reversal will be. Short-term Volatility Cycle Signal: Fully Bearish Volatility charts and P/C ratio charts are all showing a high probability of more bearishness. (See chart discussions further below.) Keep in mind that even though the big picture market condition is bearish, and the short-term signal is "Fully Bearish", the market will still have bounces. The bounces can make everything appear all right temporarily, but until there's multi-day confirmations, the bears still have the upper hand. Key price levels The table below has been fully updated. Trade plan We will post updates to the trade plan pre-market on Tuesday. There's a lot that can happen between now and then. Signal: Volatility ($VVIX $VIX $VXN $RVX) Read more about $VIX $VXN $RVX $VVIX here. Even though on the surface $VIX $VVIX $VXN $RVX all show lower highs right now, the intraday charts continue to show rising 200 EMA lines. This means that the volatility-based short-term signal continues to be "Fully Bearish". Signal: Trader Hedging (Equity Put/Call ratio) The current equity P/C ratio shows a rising 200 EMA line, which implies "Fully Bearish". Signal: Market Breadth (Advance-Decline net issues) And now a tiny bit of good news for the bulls. Small caps A/D chart below shows rising patterns. We'll declare this as not "Fully Bearish". But we won't categorize it as "Tilt Bullish" yet. Hedging by Dealers Read more about how options are impacting the market and the effects of dealer hedging here. Below are the updated volatility trigger levels.
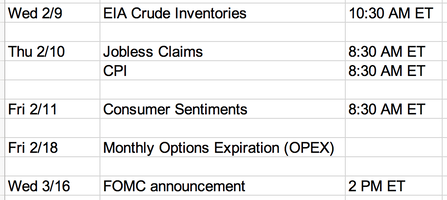
As of this writing, $SPX $NDX IWM are still below their trigger levels. So we can expect continued wild price movements as dealer hedging fuels volatility rather than dampening it. Other signals for big picture consideration The good news for the bulls is the Dark Pool Index (DIX) shows silent money are still steadily buying $SPX. They've been at it since 1/25. This is a very strong bullish divergence for $SPX. Another major bullish divergence is the bottoming patterns shown on TLT IEF LQD JNK charts for multiple days last week. This is also a strong bullish divergence for stocks. We trade 3x ETFs such as TQQQ TNA SOXL LABU UVXY using proprietary analysis of volatility. Subscribe to get our latest analysis, trade plans and live intraday trades. Current trade record here. We trade 3x ETFs such as TQQQ TNA SOXL LABU UVXY using proprietary analysis of volatility. Subscribe to get our latest analysis, trade plans and live intraday trades. Current trade record here. Updates 2:30 PM ET - Sunday Upcoming key dates This week is light in economic reports, but there is a big one on Thursday. CPI numbers will undoubtedly move the market one way or another. Projections for February You may have noticed that volatility moves in cycles that spans the following 4 phases, typically within a one month period.
Currently our system composite signal is still "Approaching Bullish". There is a high probability that we will see the following scenario.
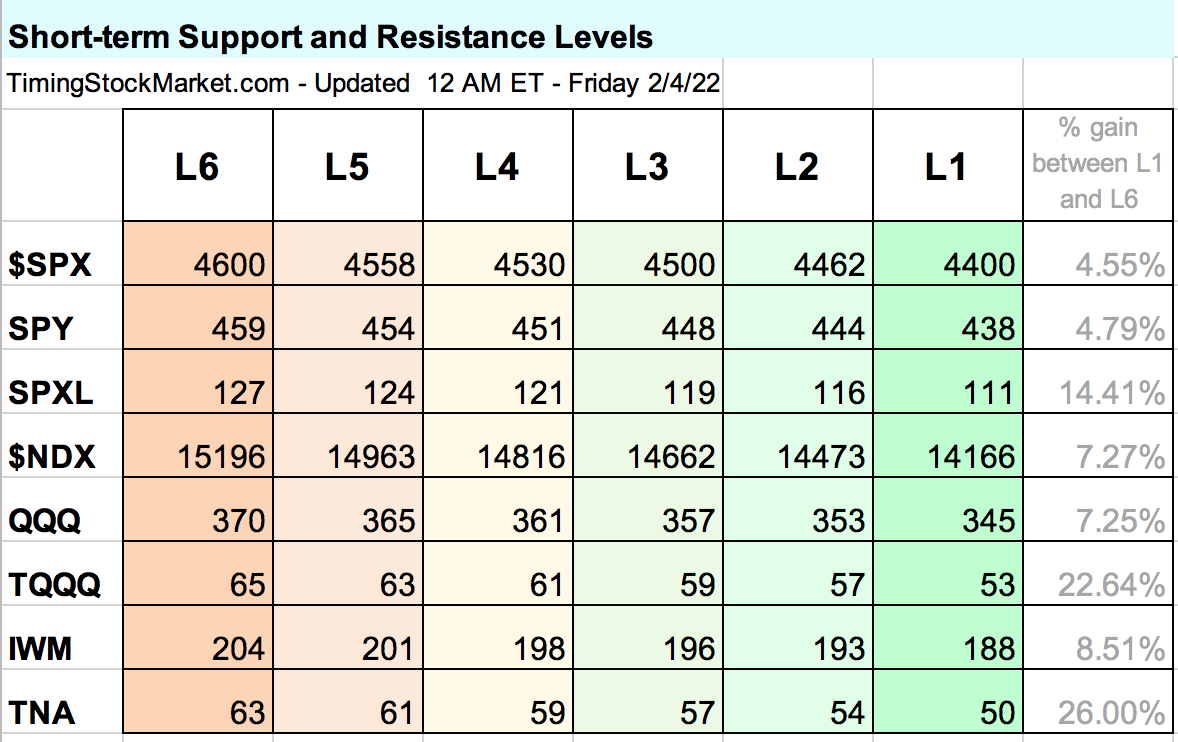
Please keep in mind that these are projections, not guarantees. But we do think that the volatility cycle will traverse through some kind of timeframe similar to above. When will the next big sell-off be? No one can really predict this. However, there is one indicator we can monitor that is fairly reliable. Keep an eye on $VIX when our signal turns "Fully Bullish", most likely this week. If this bullish cycle approaches its end without $VIX dropping below 18, $VIX may be setting itself up for a really big spike that can reach 44 - 45. If this happens, $SPX $NDX IWM can drop lower than 1/24 levels. Key price levels This table was last updated on 2/4.
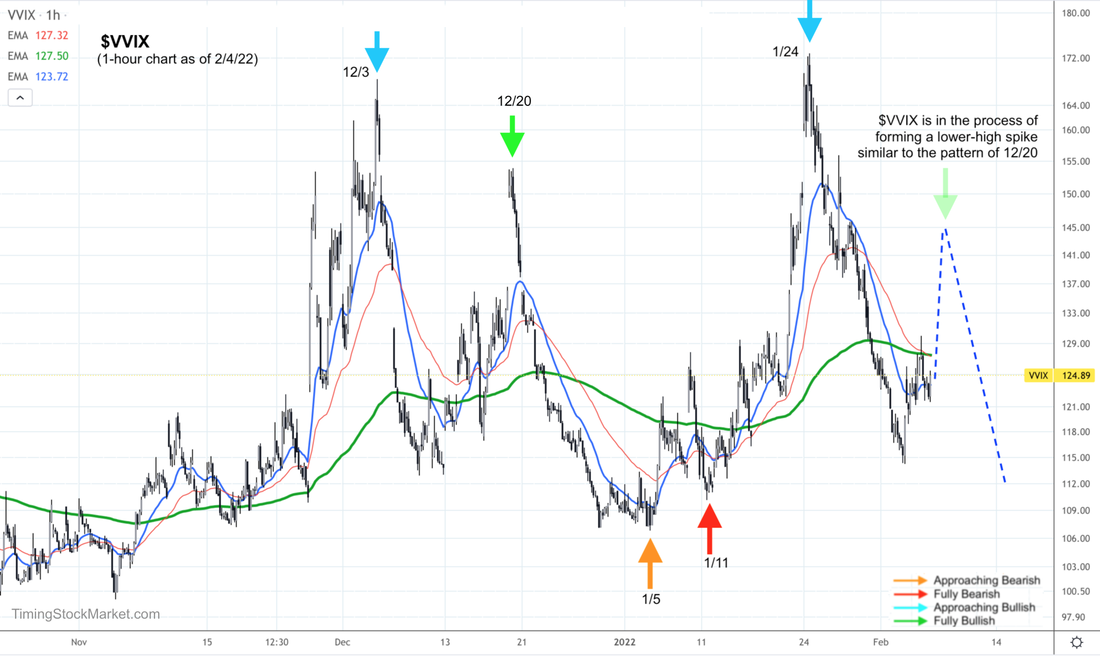
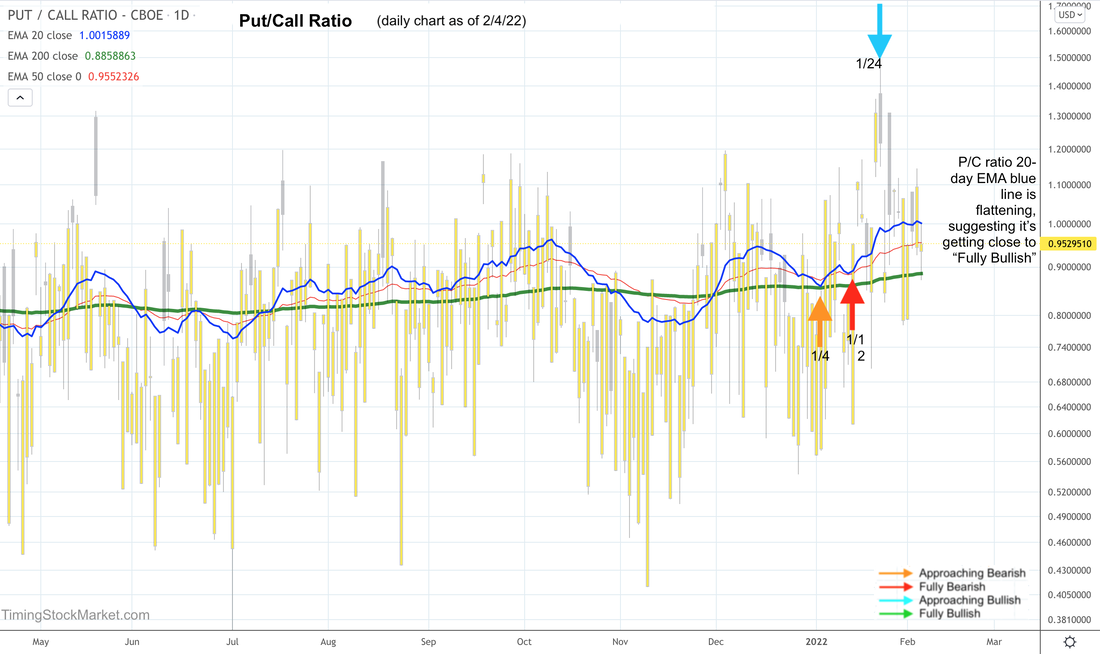
Trade Plan Given that $VIX is likely to spike up quickly at the start of the week, we will do a quick trade to capture this spike in $VIX and the corresponding drop in IWM. Once the composite signal turns “Fully Bullish”, we will place buy orders to scale into SPXL and TQQQ between L1 and L2. Click here for Signal Trades spreadsheet. Volatility: $VVIX $VIX $VXN $RVX Read more about $VIX $VXN $RVX $VVIX here. All volatility charts have turned "Approaching Bullish" by end of 1/24. This signal is still intact. Last Sunday we wrote: looking for $VVIX chart pattern to anchor at or below its 200-hour EMA green line. That is exactly what $VVIX did this past week. Now $VVIX should form a quick lower-high spike (relative to 1/24). This will shake out the weak hands and turn the signal "Fully Bullish". Hedging by Traders: Put/Call Ratio The signal from P/C ratio chart has turned "Approaching Bullish" by end of 1/24. This signal is still intact. In P/C ratio daily chart below, its 20-day EMA is forming a flat top. This indicates that the signal is getting close to turning "Fully Bullish". Hedging by Dealers Read more about how options are impacting the market and the effects of dealer hedging here. Below are the updated volatility trigger levels.
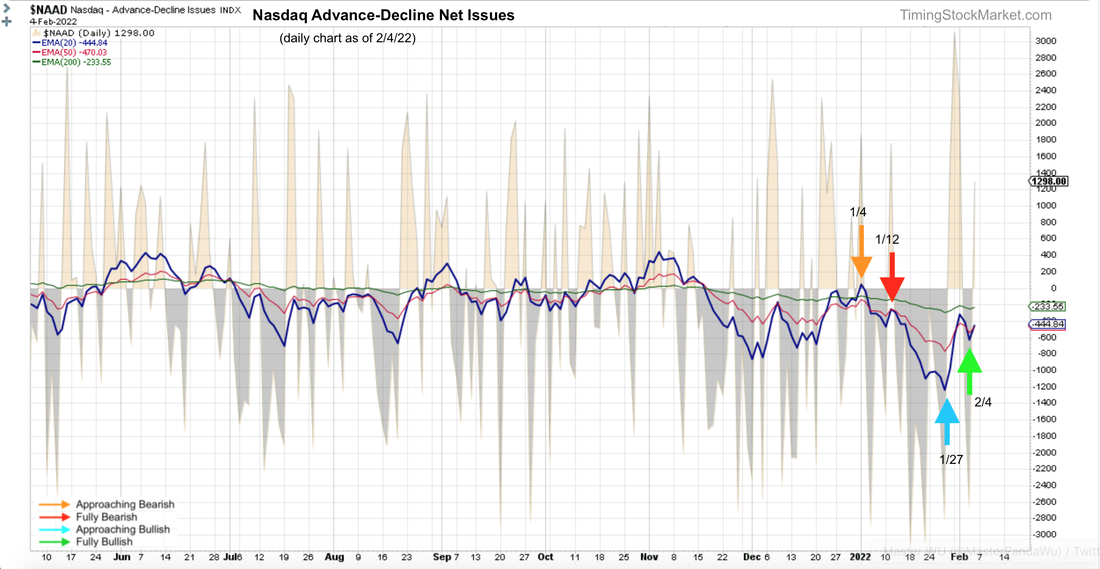
As of this writing, all indices are still below their trigger levels. This means dealer hedging will fuel volatility rather than dampen it. So expect big price swings to continue both up and down. Market Breadth: Advance-Decline Net Issues And now some good news for the bulls. The signal for all A/D charts have changed to "Fully Bullish" by end of 2/4. This bolsters our thesis that the composite signal is about to turn "Fully Bullish", after one more volatility spike to shake out the weak hands. Other Signals for Big Picture Consideration The Dark Pool Index (DIX) shows silent money had a huge bullish reversal early last week. The buying has eased up somewhat, but is still continuing steadily throughout the week. This is an important under-the-hood bullish indicator for the short term. However, price actions in the bond market were quite bearish last week. Bond volatility is grinding upward slowly. These are not bullish long-term signals for stocks. Click here for Signal Trades spreadsheet. To Read We urge you to read this article about risk management and position sizing. 1% Risk Rule If you are new to trading 3x leveraged ETFs like TQQQ TNA SOXL FNGU, read: Why 3x ETFs like TQQQ lose money over the long term If you are new to trading inverse ETFs like SQQQ TZA SOXS FNGD, read: The risks of investing in inverse ETFs Disclaimer The information presented here is our own personal opinion. Consider it as food for thought. We are not offering financial advice. We are not promoting any financial products. We are not registered financial advisers or licensed brokers. We make no guarantee that anything will unfold according to our projections. You are proceeding at your own risk if you follow our trades. |
Archives
July 2024
Categories |
 RSS Feed