|
We trade 3x ETFs such as TQQQ TNA SOXL LABU UVXY using proprietary analysis of volatility. See trade record here. Updates 12 AM EST - Monday 11/22/21 Key dates This is a major holiday week for US stock market.
Here's the economic calendar for the full week. Wednesday is heavy-duty report day. Monday: Existing Home Sales Wednesday:
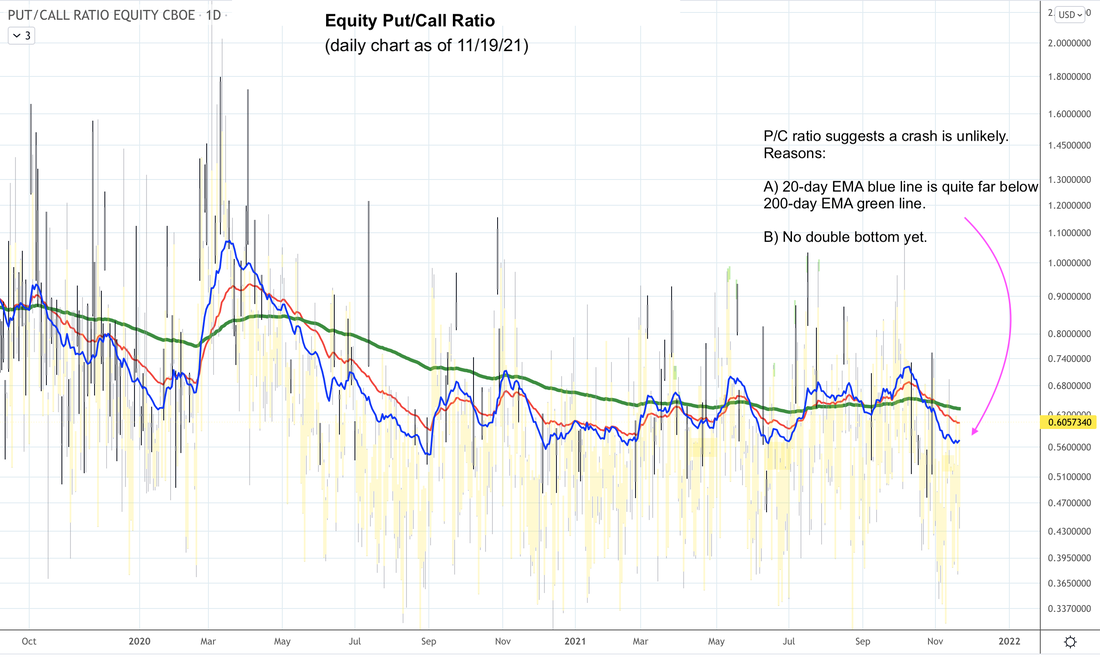
Volatility $VVIX (volatility of $VIX) hourly chart below tells us that a quick dip in price is possible early in the week. $VVIX 20-hour EMA red line and 50-hour EMA blue line are still above the 200-hour EMA green line and rising. This means the possibility of a $VIX spike is still high, just like the pattern shown at (1). There's a good chance we'll see this spike on Monday. We don't, however, expect this spike to be very big or long lasting. Alternatively, if the red and green EMA lines start to turn down like the pattern at (2), then $VVIX is dropping and conditions are back to fully bullish. 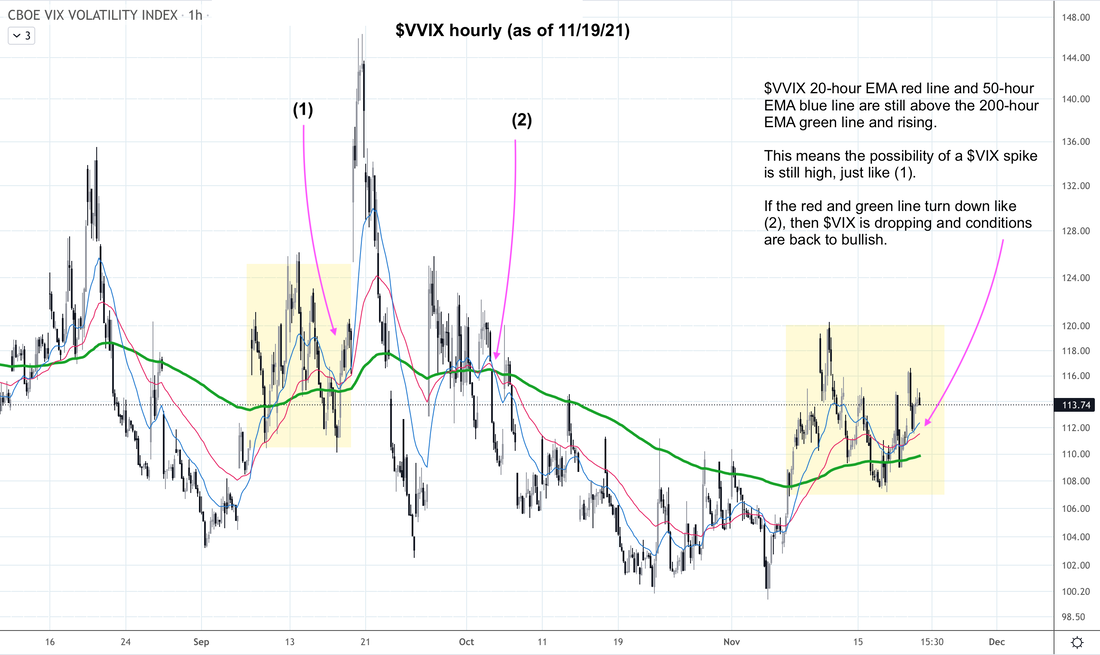 Equity Put/Call Ratio Today we want to show P/C ratio daily chart just to put things in perspective. This chart tells us that while a quick price dip is possible, a crash is unlikely. Reasons:
 Advance-Decline Net Issues The A/D lines for NYSE and Nasdaq have all dropped sharply for multiple days now. This is particularly true for Nasdaq. This is a bearish divergence from the bullish price actions for $NDX and $SPX. 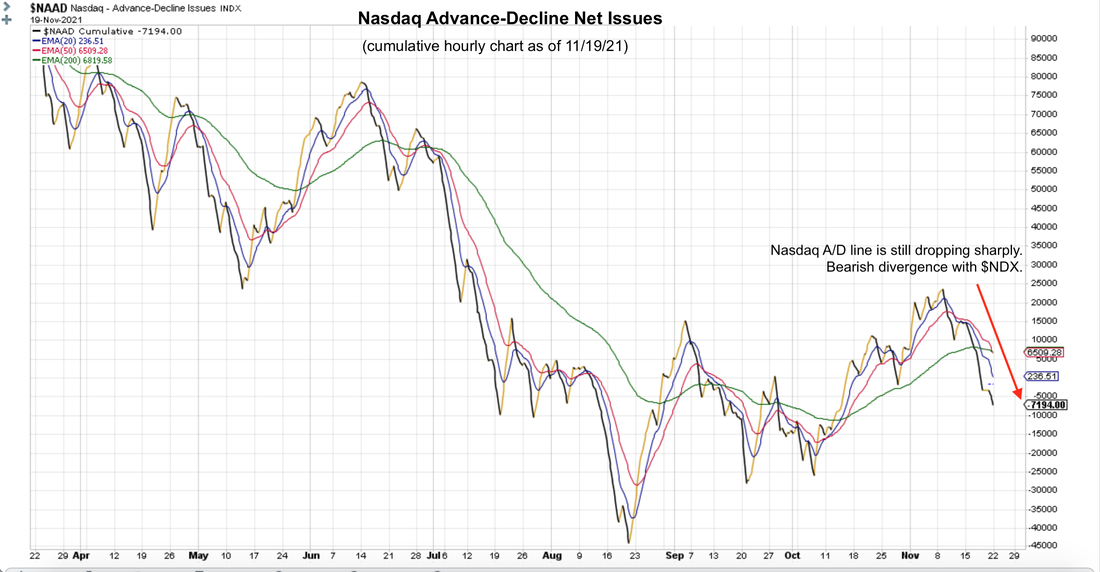 Seasonality Statistically, this is a bullish period of the trading year. Dealer Hedging As long as the $SPX $NDX IWM stay above these price levels shown below, dealer hedging activities will keep price swings smallish, resulting in calmer market. If $SPX $NDX IWM drop below these levels, dealer hedging activities will feed into price swings, resulting in much more volatile market.
Observe that IWM closed on Friday at below the key level of 234 above. So we may see bigger price swings for IWM TNA Monday. Short-term Key Levels The table below has been fully updated. 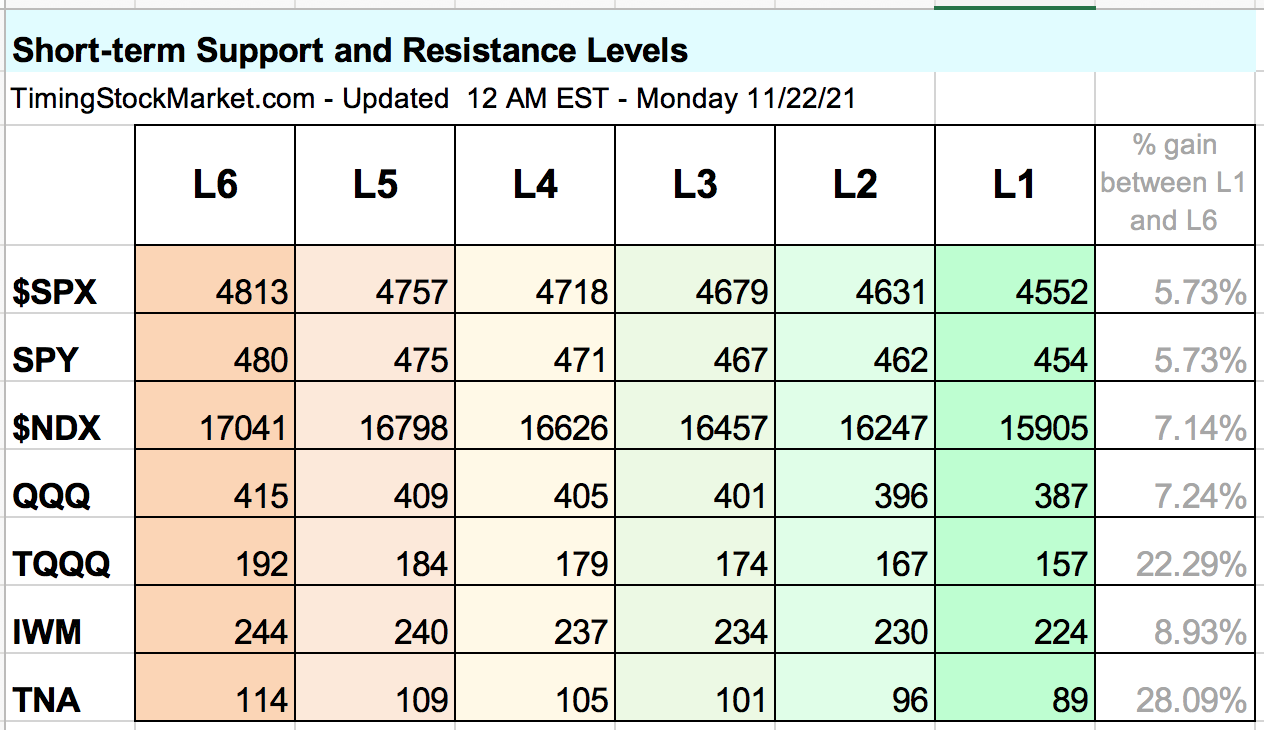 Trade Plan Subscribe to get our latest analysis, trade plan and live intraday trades. See trade record here. Disclaimer The information presented here is our own personal opinion. Consider it as food for thought. We are not offering financial advice. We are not promoting any financial products. We are not registered financial advisers or licensed brokers. We make no guarantee that anything will unfold according to our projections. You are proceeding at your own risk if you follow our suggestions.
1 Comment
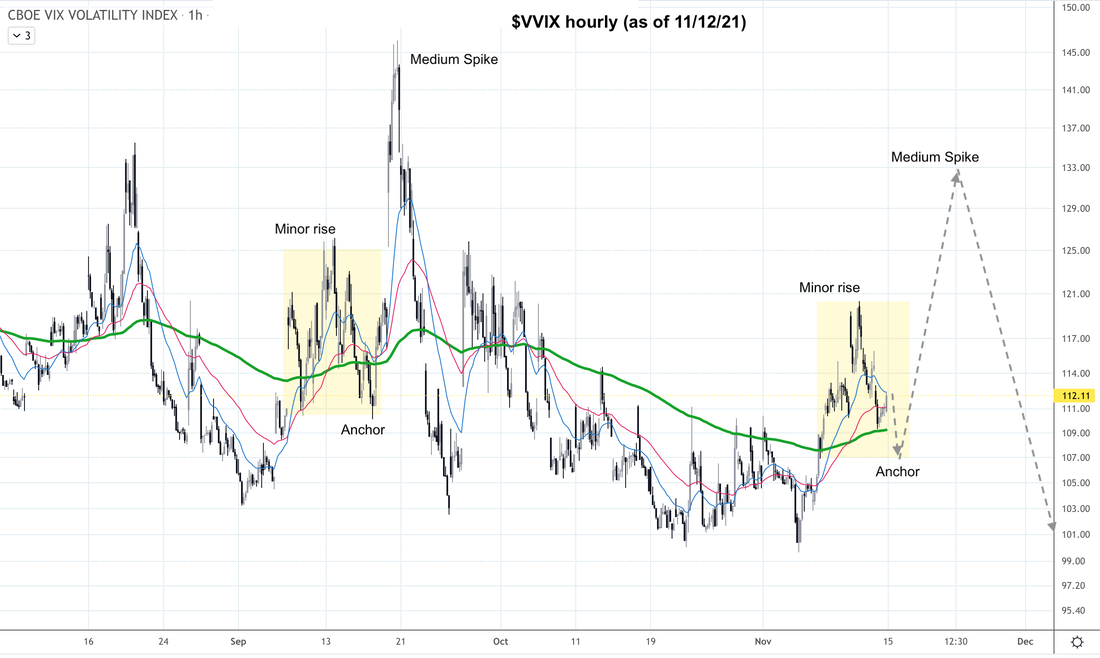
We trade 3x ETFs such as TQQQ TNA SOXL LABU UVXY using proprietary analysis of volatility. See trade record here. Updates 12 AM EST - Monday 11/15/21 Key dates Here's the economic calendar for the full week. Look for these key reports that may move the market. Tuesday: Retail Sales; Industrial Production Wednesday: Housing Starts Thursday: Jobless Claims The key events this week will be the monthly options expiration. Wednesday: $VIX options expiration Friday: options expiration for equity, equity index, ETF, ETN Click here for earnings calendar for this week. Volatility So far $VVIX is following the Rise>>Anchor>>Spike pattern that we started showing early last week. There is a high probability that $VVIX will follow the updated path shown below. Not a guarantee, but a high probability.
 Equity Put/Call Ratio In the P/C ratio 30-minute chart below, its 200 EMA green line has flattened out and is likely to continue sideway. This indicates that traders have gone from a super bullish buy-calls mindset from early November, to a more cautious "buy-puts-to-hedge" mindset. 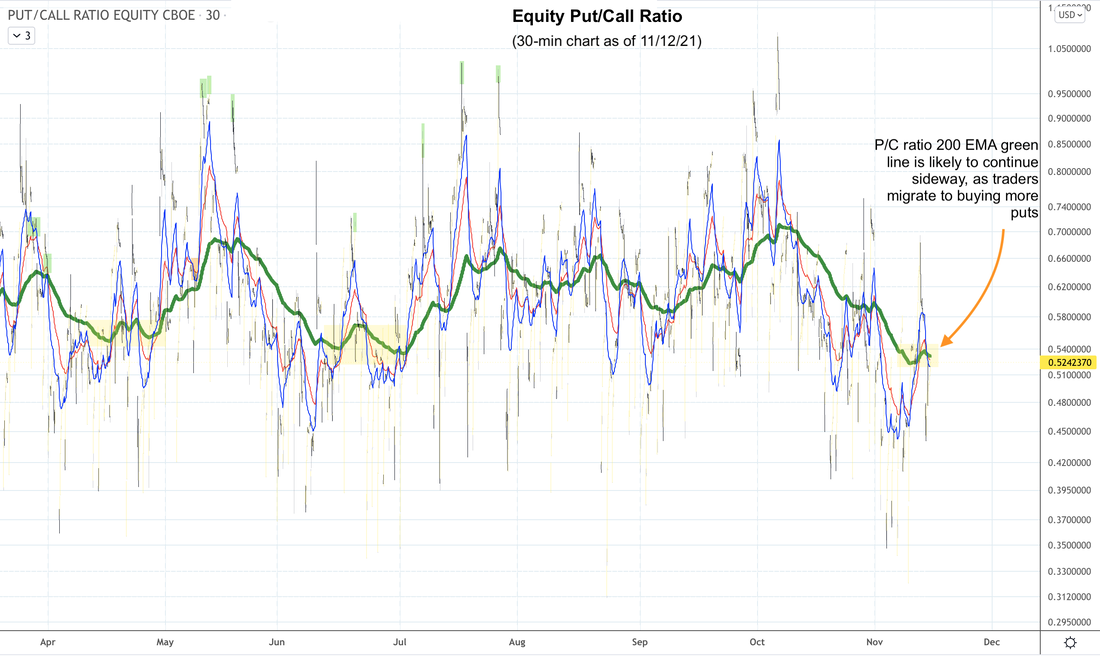 Advance-Decline Net Issues >> bullish NYSE and Nasdaq A/D lines are still above their 200-hour EMA on their cumulative hourly charts. Overall message is still bullish. However, keep an eye on Nasdaq A/D as it is getting close to its 200-hour EMA green line. If this green line starts to flatten out and go sideway, or turn downward, it means Nasdaq market breadth is turning bearish. 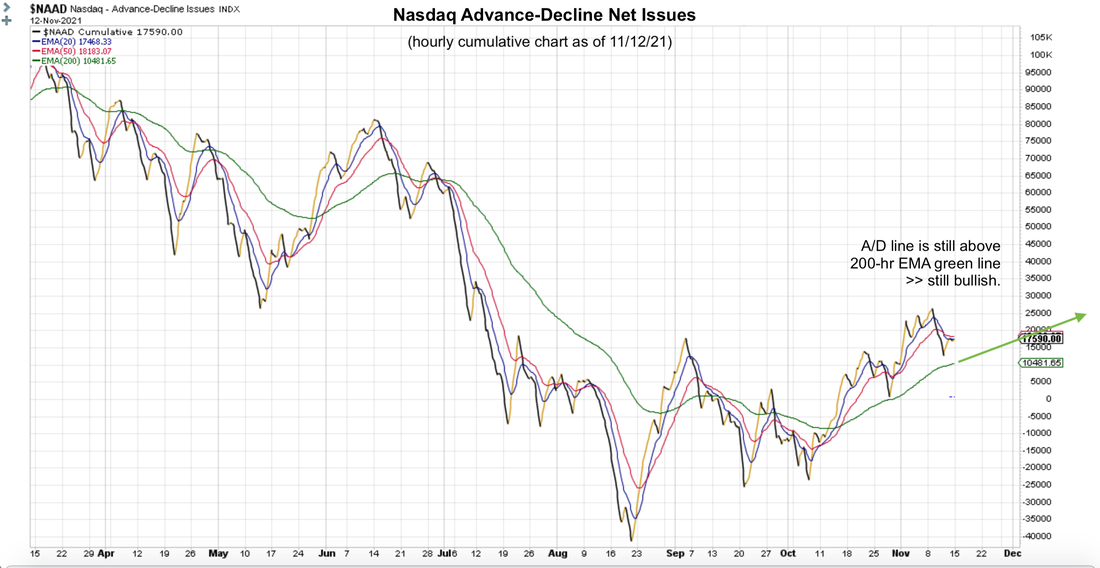 Seasonality >> bullish Statistically, this is a bullish period of the trading year. Dealer Hedging >> bullish As long as the $SPX $NDX IWM stay above the price levels shown below, dealer hedging activities will keep price swings smallish, resulting in calmer market. If $SPX $NDX IWM drop below these levels, dealer hedging activities will feed into price swings, resulting in much more volatile market.
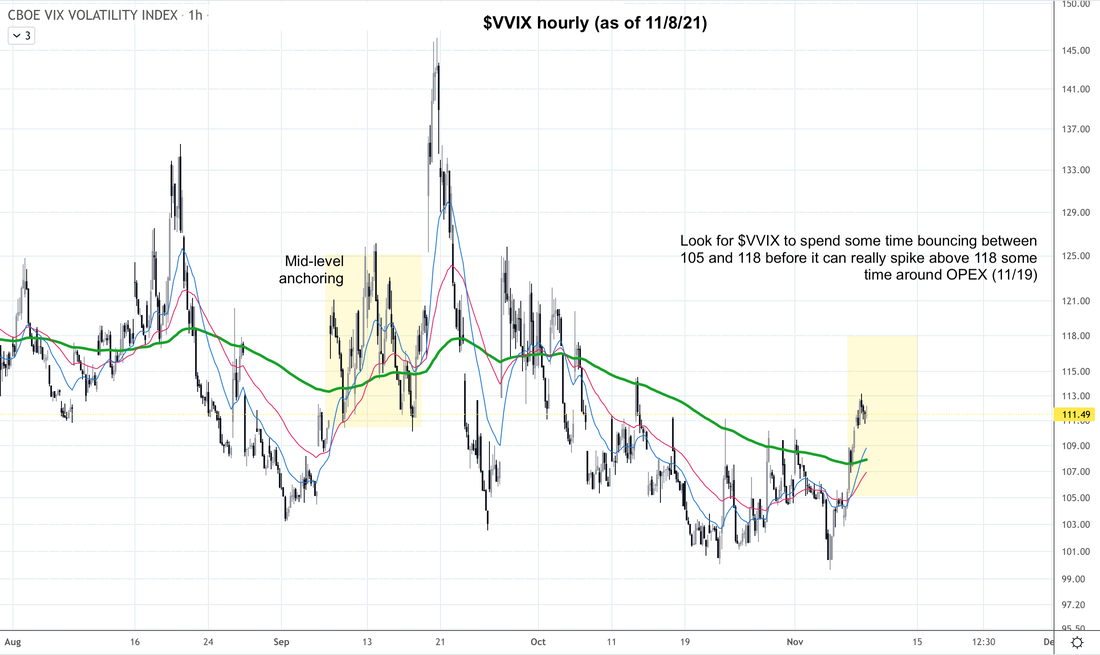
Short-term Key Levels The table below has been fully updated. 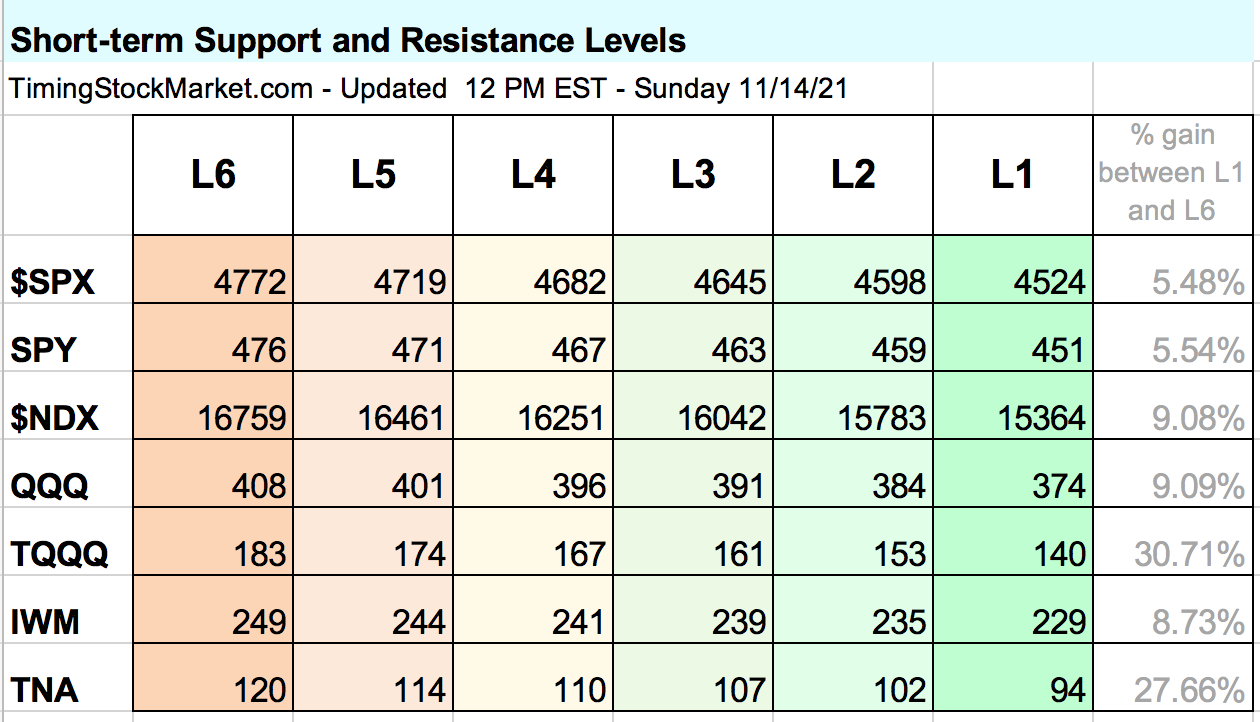 Trade Plan Subscribe to get our latest analysis, trade plan and live intraday trades. See trade record here. Disclaimer The information presented here is our own personal opinion. Consider it as food for thought. We are not offering financial advice. We are not promoting any financial products. We are not registered financial advisers or licensed brokers. We make no guarantee that anything will unfold according to our projections. You are proceeding at your own risk if you follow our suggestions. We trade 3x ETFs such as TQQQ TNA SOXL LABU UVXY using proprietary analysis of volatility. Updates 10:51 AM EST - Tuesday 11/9/21 Volatility As we've been anticipating, the minor spike in $VVIX $VIX $VXN $RVX is happening. Pay close attention to $VVIX hourly chart. As we posted earlier this morning, $VVIX is likely to bounce around between 105 and 118 next few days. When $VVIX anchors at the 200-hour EMA green line is when it is likely to really spike. This will most likely happen early next week, ahead of OPEX (11/19). This is where we are likely to exit long, locking in profits for TQQQ TNA. 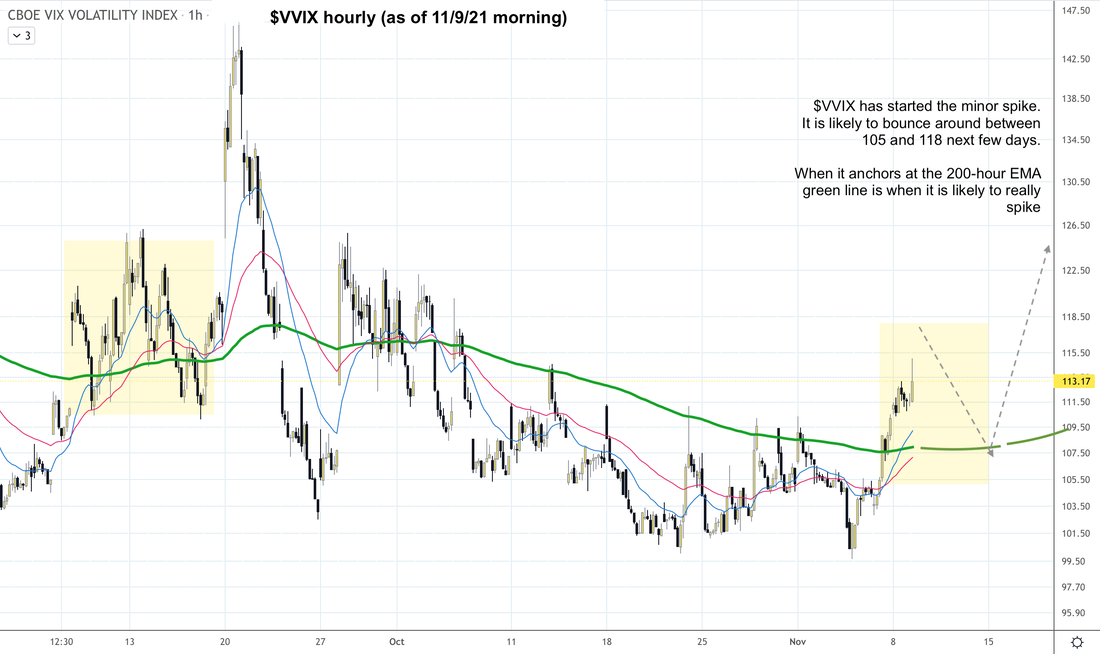 Updates 8:50 AM EST - Tuesday 11/9/21 Volatility >> time to think about locking in profits As we get closer to November options expiration (OPEX 11/19), it's time to monitor $VVIX more closely. $VVIX has a minor spike above its 200-hour EMA green line as anticipated. Now it's likely to spend some time bouncing between 105 and 118 to anchor some more. Then it will be in a better setup to have a moderate spike above 118, around OPEX.
 Equity Put/Call Ratio >> bullish In the P/C ratio 30-minute chart below, keep an eye on the 200 green line. It needs to flatten and go sideway for a few days before it can really spike. So for right now, it is bullish. When this ratio spikes, it means traders are buying more puts than calls in an effort to hedge. That's more bearish. 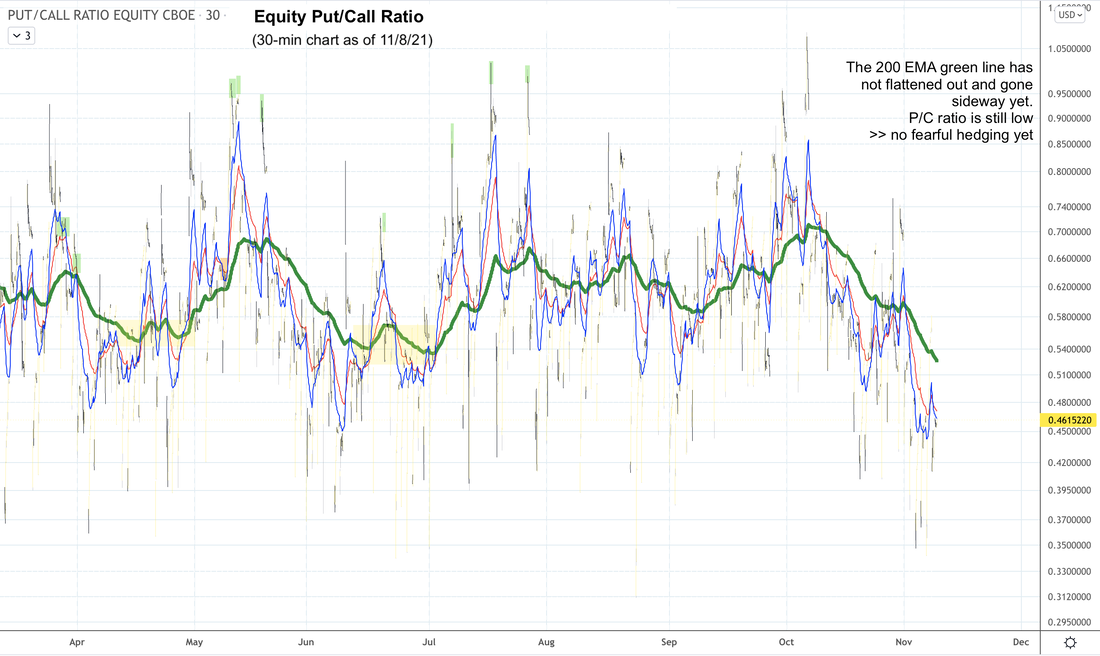 Advance-Decline Net Issues >> bullish NYSE and Nasdaq A/D lines are still above their 200-hour EMA on their cumulative hourly charts. Overall message is still bullish. 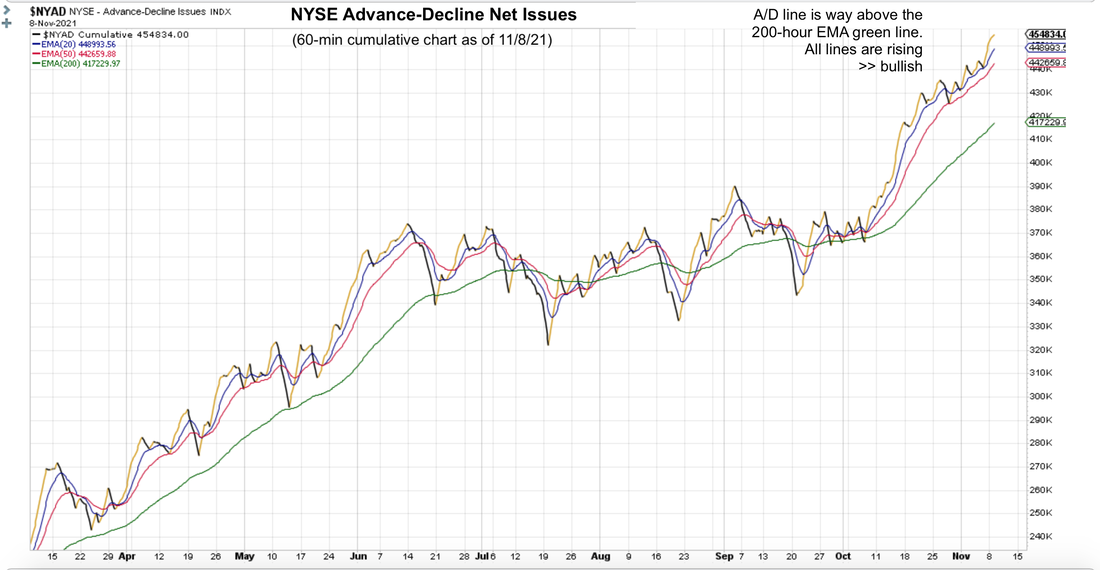 Seasonality >> bullish Statistically, this is a bullish period of the trading year. Short-term Key Levels The table below is still the same. 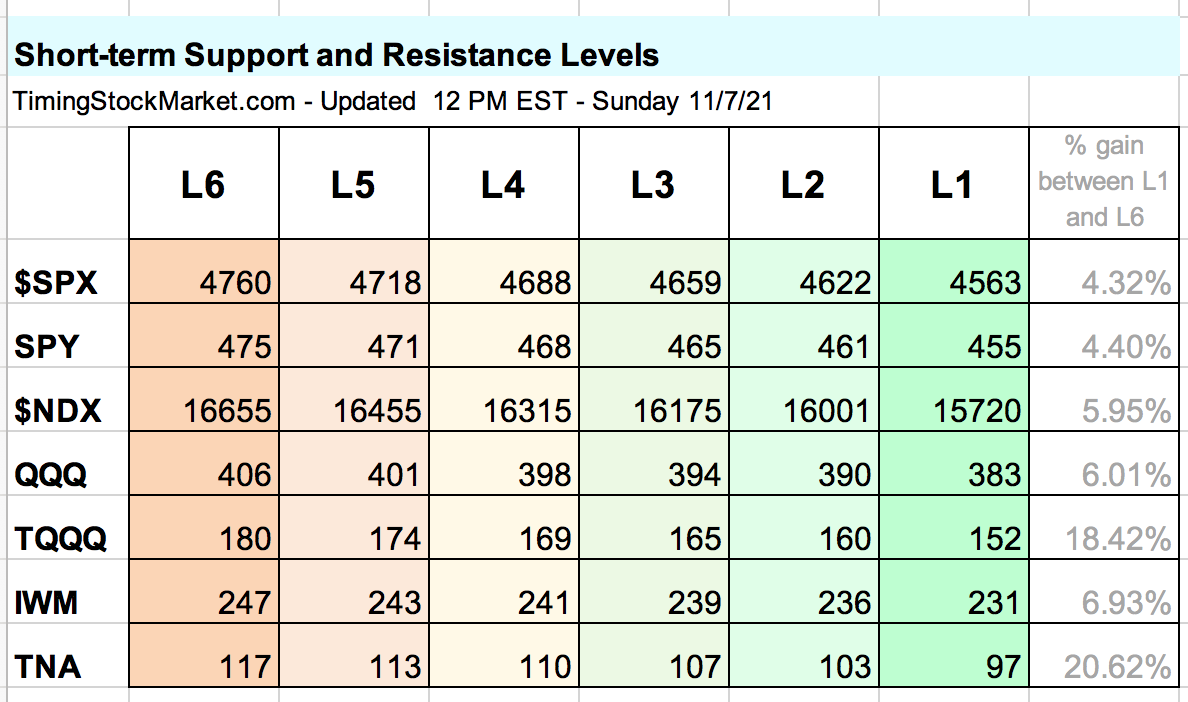 Trade Plan Subscribe to get our latest analysis, trade plan and live intraday trades. Disclaimer The information presented here is our own personal opinion. Consider it as food for thought. We are not offering financial advice. We are not promoting any financial products. We are not registered financial advisers or licensed brokers. We make no guarantee that anything will unfold according to our projections. You are proceeding at your own risk if you follow our suggestions. We trade 3x ETFs such as TQQQ TNA SOXL LABU UVXY using proprietary analysis of volatility. Updates 12:00 AM EST - Monday 11/8/21 Key dates Here's the economic calendar for the full week. Tuesday: Producer Price Index (PPI) Wednesday: Consumer Price Index (CPI) Friday: Consumer Sentiments; Job Openings (JOLTS)
Here are the companies reporting this week including PYPL, TME, COIN, DIS, DHI, PLTR, TCEHY. Volatility There is no guarantee in any pattern, but keep an eye out for the following pattern that $VIX $VXN $RVX may follow.
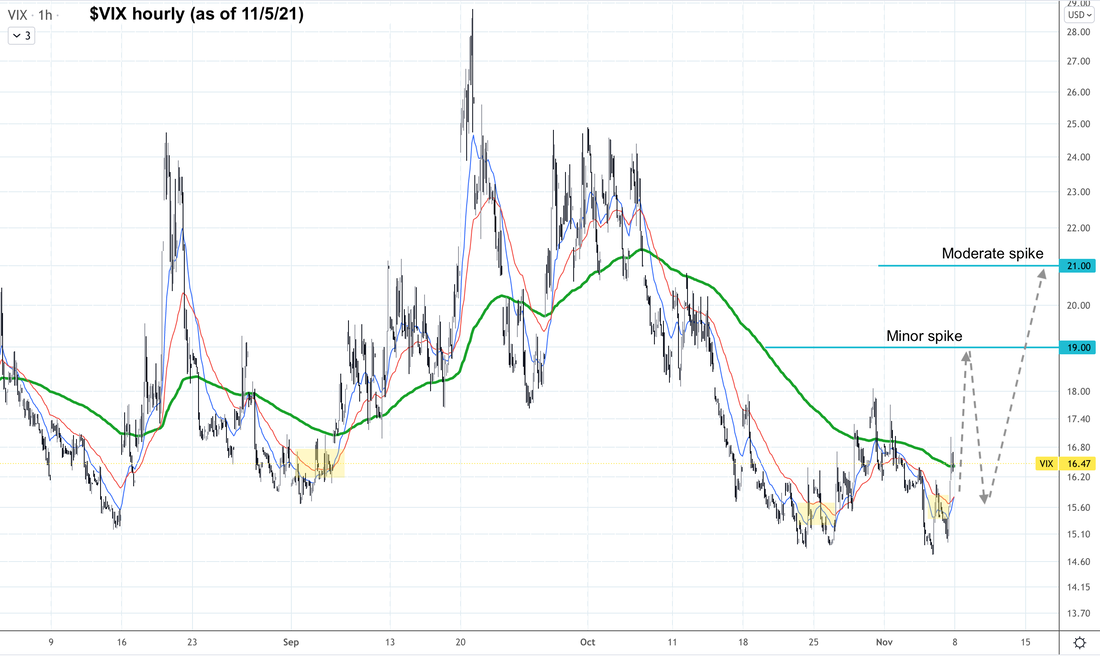 Equity Put/Call Ratio In the P/C ratio 30-minute chart below, keep an eye on the 200 green line. It needs to flatten and go sideway for a few days before it can really spike. So for right now, it is bullish. When this ratio spikes, it means traders are buying more puts than calls in an effort to hedge. That's more bearish. 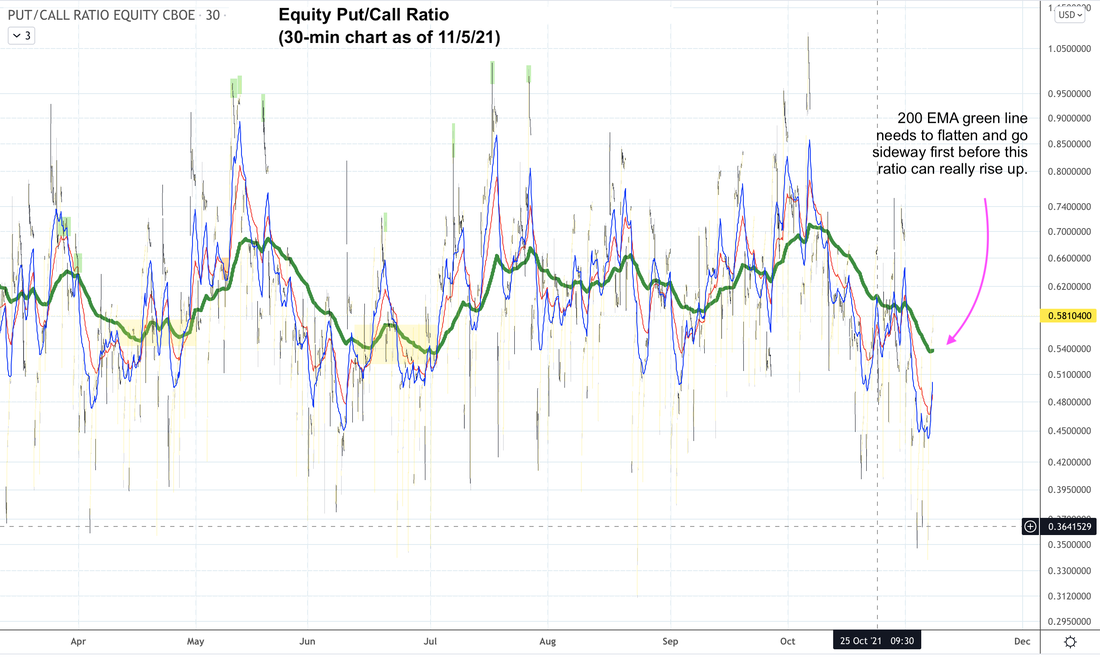 Advance-Decline Net Issues >> bullish NYSE and Nasdaq A/D lines are still above their 200-hour EMA on their cumulative hourly charts. Overall message is still bullish. 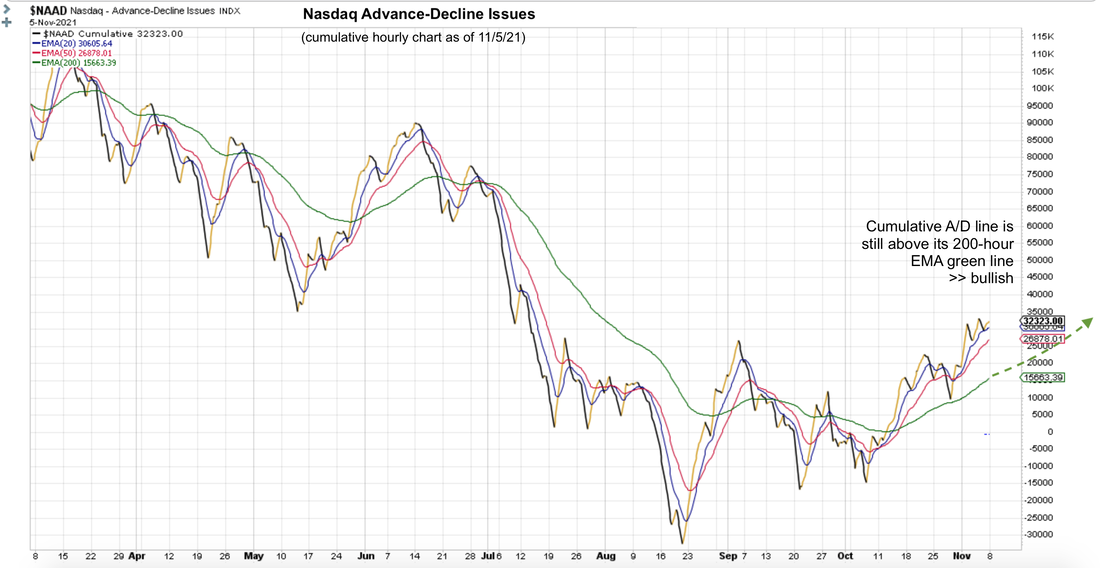 Seasonality >> bullish Statistically, this is a bullish period of the trading year. Positive gamma >> bullish Gamma is positive right now for $SPX $NDX IWM. This means that dealers are hedging their books by buying into weakness, and selling into strength. The net effect is supportive of a steady march upward, without outsize swings. Short-term Key Levels The table below has been fully updated. Trade Plan Subscribe to get our latest analysis, trade plan and live intraday trades. Disclaimer The information presented here is our own personal opinion. Consider it as food for thought. We are not offering financial advice. We are not promoting any financial products. We are not registered financial advisers or licensed brokers. We make no guarantee that anything will unfold according to our projections. You are proceeding at your own risk if you follow our suggestions. We trade 3x ETFs such as TQQQ TNA SOXL LABU UVXY using proprietary analysis of volatility. Updates 2:45 AM EST - Friday 11/5/21 Volatility >> bullish $VIX $VXN $RVX are showing similar chart patterns:
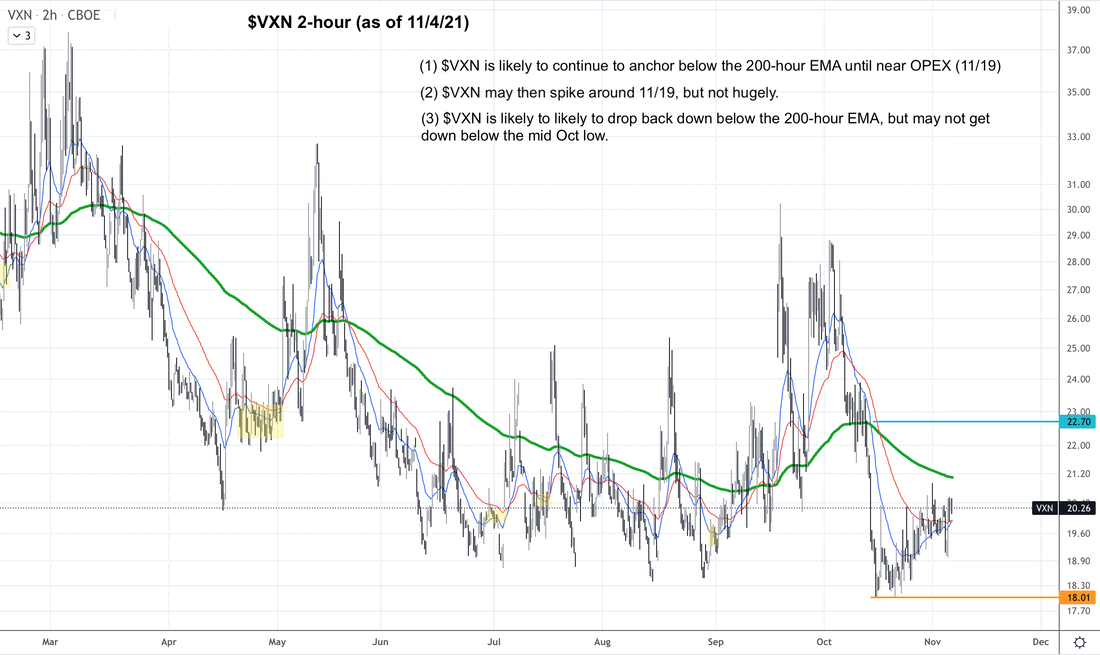 Advance-Decline Net Issues >> bullish NYSE and Nasdaq A/D lines are still above their 200-hour EMA on their cumulative hourly charts. Overall message is still bullish. Seasonality >> bullish Statistically, this is a bullish period of the trading year. Positive gamma >> bullish Gamma is positive right now for $SPX $NDX IWM. This means that dealers are hedging their books by buying into weakness, and selling into strength. The net effect is supportive of a steady march upward, without outsize swings. Short-term Key Levels $NDX QQQ TQQQ have been updated. All other are the same. 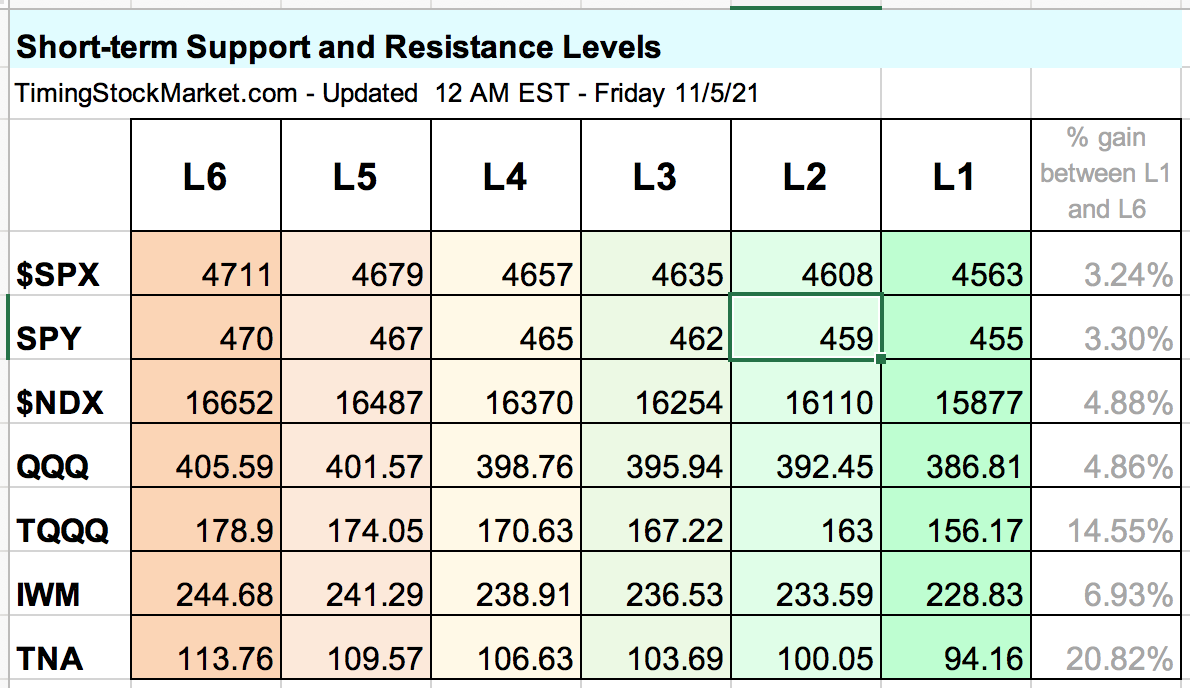 Trade Plan Subscribe to get our trade plan and live intraday trades. Trade record here (281% gain in 15 months). ... Take advantage of introductory low rate of only $39 per month! |
Archives
July 2024
Categories |
 RSS Feed
|
|
Copyright (c) 2019-2024 LOOK Systems LLC
All rights reserved. |