|
On Thursday 3/19/20, our system had identified a bullish signal by $SPX and $NDX after hours. So we posted the following updates for our members. This signal accurately forecasts the arrival of the big bounce that started on 3/23 for $SPX $NDX $RUT. This is an example of the highly accurate and timely daily updates that our members receive. Updates 7:02 PM EST - Thursday 3/19/20 The Down Trend is still intact. The true final bottom is not in yet. However our system has issued a "short-term significant bounce" signal, based on the market internal indicators. The zone near Support1 is a low-risk setup to do partial entry of small positions that are long $SPX $NDX, such as SPY QQQ TQQQ. Trade small. Use a tight stop. If you keep your entry small for now, you can hold it overnight tonight. Beware that dropping below Support1 is quite bearish. 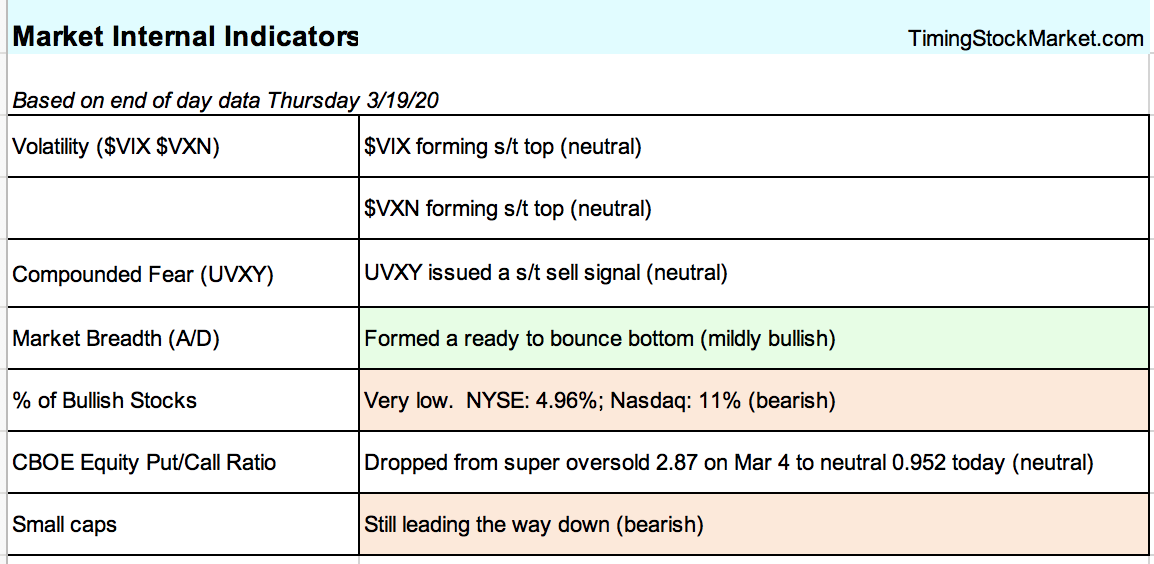 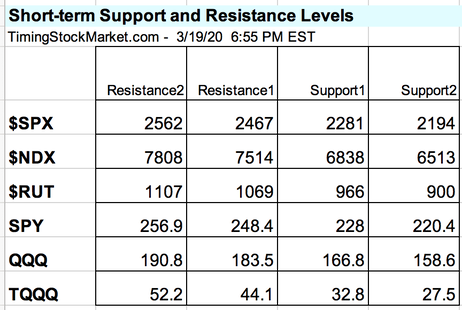 There is now a significant new signal as of 3/27/20.
SUBSCRIBE to read our analysis of this signal for $SPX $NDX $RUT SPY QQQ TQQQ. Take advantage of our introductory low rate of just $39/month. You can cancel at any time.
0 Comments
The Big Picture and The Long Term Portfolio We received a lot of questions this week from our members. There was a common theme in the question: Is this Down Trend done yet? Are we about to start an Up Trend given the price actions at the end of the week? The answers are:
So where are we in this Down Trend? To reliably answer that, we turn to $VIX $VXN charts. In our experience, $VIX $VXN tend to follow certain recurring patterns during Down Trend or Major Pullbacks. And $SPX $NDX $RUT tend to follow these patterns too, but analyzing them is harder. So we go back and use $VIX $VXN patterns from the crash of 2008 to help guide us through this current crash. Last week, we introduced a new term “Dive”. “Dive” refers to the big down segments that constitute the core of the trend. A major Dive in a Down Trend is equivalent to a major Surge in an Up Trend. This Down Trend most likely will have 4 to 5 Dives. $SPX $NDX $RUT are likely finishing up Dive1 right now. Below is $SPX hourly chart from the crash of 2008. It shows 4 major Dives spanning a period of 6 months that comprised the entire Down Trend. (We use the hourly chart because the show the Dives better.) 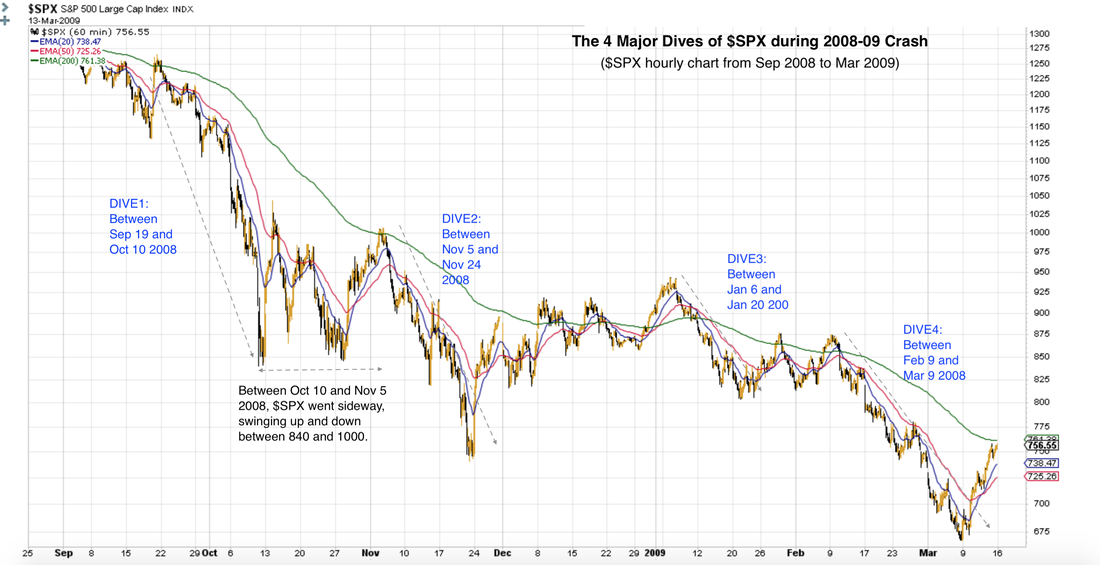 The current Down Trend that started on Feb 20 is likely to experience 4 major Dives also, and may span anywhere from 6 to 8 months. Here is a projection of how the 4 Dives can unfold, and how low $SPX is likely to go during this Down Trend. Subscribe to read the rest of this article, and all the latest intraday updates for $SPX $NDX $RUT SPY QQQ TQQQ. Take advantage of our introductory low rate of just $39/month. You can cancel at any time. We have been posting lots of intraday and after hour updates.
Subscribe to read all the latest analysis, as well as our highly useful table of support and resistance levels for $SPX $NDX $RUT SPY QQQ TQQQ. Take advantage of our introductory low rate of just $39/month. You can unsubscribe at any time. The Big Picture and The Long Term Portfolio Tonight the Fed brought out their big weapons, but they failed to ignite a burst of buying. Instead, market responded by sending futures sharply down, and triggered limit down in the process. QE is a stop-gap measure to keep the financial system from a meltdown. But QE isn't a vaccine against the coronavirus. The Fed cannot stop social distancing, or lockdown, or quarantine. Until human activities can flow freely, economic growth cannot happen. In fact, the opposite is happening. We are seeing sudden and massive economic contractions. It is the equivalent of an economic heart attack. Back in early February, we shared this weekly chart with you, explaining that stocks are very overbought and are vulnerable to a serious sell-off. We pointed out that $SPX could drop as low as the 200-week EMA. 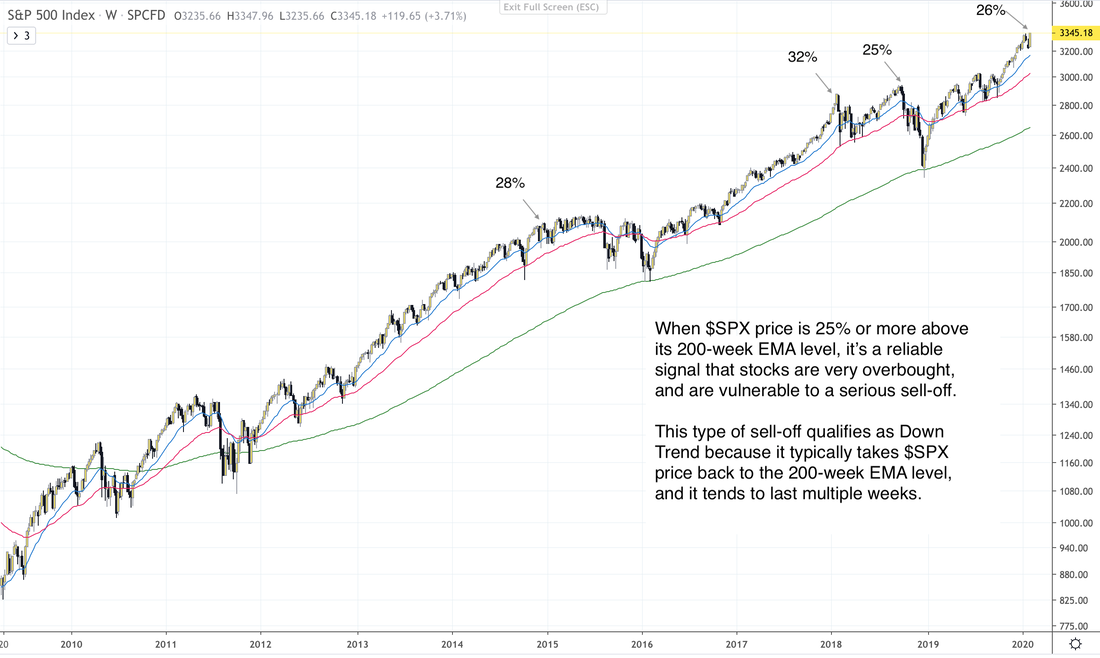 At the time the projection was greeted with skepticism, as the stock market was seemingly reaching an all-time high every day. It would mean big drop from 3385 to 2660. Fast forward 5 weeks, and here we are. On Thursday March 12, $SPX spiraled down to a low of 2479. Let’s zoom out on the monthly chart and take a look at how low prices can potentially go from here. Subscribe to read the full article, and get access to our daily trading plans immediately. Subscribe now and take advantage of our introductory low rate of only $39 per month. We have been posting lots of intraday and after hour updates.
Subscribe to read all the latest analysis, as well as our highly useful table of support and resistance levels for $SPX $NDX $RUT SPY QQQ TQQQ. Navigating The Crash
We won’t make you cry by discussing the stock market crash that’s happening right now. But let’s discuss what might be coming around the corner. Last night we outlined the super bearish scenario that can take $SPX down to the low of 2016. That’s $SPX reaching around 1810 potentially. This scenario may not happen right away, but there is now a rising probability of it happening, and it can unfold by end of this year. This is extremely disheartening, and not just because it may drag down our 401k accounts for a long time. Jobs, livelihood and lives will be impacted, in a big way. That’s the scariest part. So how do we provide trading advice when it’s raining black swans? The truth is we cannot. But we can share with you the lessons we learned trading through 2008-2009 crash. Maybe you can gain some insights and benefit from our experience. One of the lessons we learned is that in fast moving time like this, it’s best not to try to trade every move in the market. Whipsaw is everywhere. We may all be better off just chilling for a day or two and see how events unfold. We also learned not to chase the small bounce. The potential risk:reward ratio is not very favorable. We found that it’s better to wait for the really major support zones to be reached before betting on a substantial bounce. Finally, remember that we are in a Down Trend. So instead of obsessing about buying the dip, we should be thinking about selling the rip. Subscribe to read the full article, and get access to our daily trading plans immediately. The full article covers: Long-term Support & Resistance Levels
Market Internal Indicators
Market internal indicators give us a daily glimpse into the short-term direction of the market. Trading Plan
Subscribe now and take advantage of our introductory low rate of only $39 per month. Down Trend Still Intact The Down Trend that started on February 19 is still intact. The blowout move by $VIX $VXN on Friday 3/6 is still just an interim move. So far we have:
There are likely a few more moves at the minimum: Bounce2, Drop3, Bounce3. That’s the optimistic bullish scenario, a short-lived Down Trend that will eventually retest the lows October 2018 and then be done. In the super bearish scenario, this Down Trend can go down lower, as shown in $SPX weekly chart below. If we end up with a financial crisis similar to 2008, $SPX can drop down as low as the low of February 2016. That means $SPX can give up potentially 4 years worth of gain in a few months of sharp drops, similar to 2008-2009. 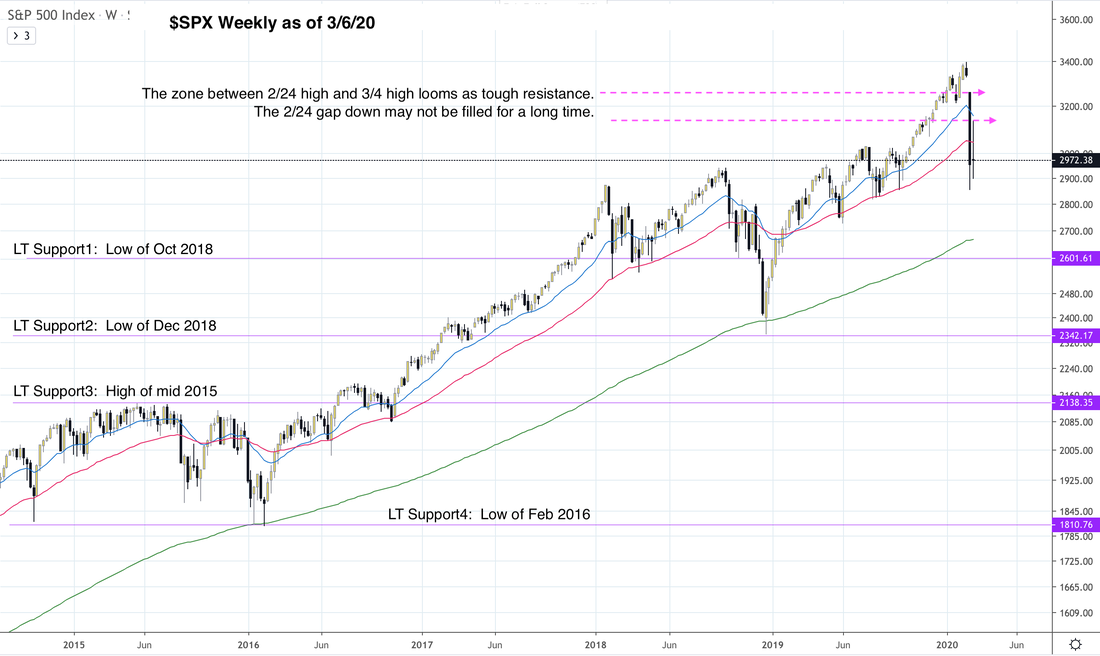 Reality is probably somewhere in between. Right now, it is simply too early to project, but here are some projections by analysts that may be of interest to you.
Note that $SPX at 2450 is the zone where the last Down Trend of ended in Dec 2018. Subscribe to read the full article, and get access to our daily trading plans immediately. The full article covers: Short-term Support & Resistance Levels
Market Internal Indicators
Market internal indicators give us a daily glimpse into the short-term direction of the market. Trading Plan
Subscribe now and take advantage of our introductory low rate of only $39 per month. The Fed announced an emergency rate cut of ½ point today. Initially, traders jumped in to buy. That pushed $SPX $NDX $RUT to strong resistance levels, where they quickly formed bearish spires and dropped quickly. The actions put an end to Bounce1.
Just to refresh your memory, here are the phases so far in this Down Trend.
This was the case of “buy the rumors; sell the news”. Traders have been bidding up prices since Fri Feb 28 in anticipation of an emergency rate cut. The Fed delivered it, but it’s not as big as everyone was hoping for. Additionally, the message from the Fed made the market nervous. According to Bloomberg: Even as the Federal Reserve chief delivered additional stimulus, he acknowledged that this easing is insufficient to solve the myriad economic and health risks posed by the coronavirus. That’s self-evident, but a message neither businesses nor consumers were ever likely to take in stride. Support & Resistance Levels The S/R levels below are short-term projections of important price levels. These are places where the majority of buyers and sellers are likely to lurk. You will want to pay attention to the change in price behaviors around these levels. Subscribe to read the full article, and get access to our daily trading plans immediately. The full article covers: Short-term Support & Resistance Levels
Market Internal Indicators
Market internal indicators give us a daily glimpse into the short-term direction of the market. Trading Plan
Subscribe now and take advantage of our introductory low rate of only $39 per month. On Feb 6, we shared an important $SPX chart with our readers and wrote :
When $SPX price is 25% or more above its 200-week EMA level, it’s a reliable signal that stocks are very overbought, and are vulnerable to a serious sell-off. This type of sell-off qualifies as Down Trend because it typically takes $SPX price back to the 200-week EMA level, and it tends to last multiple weeks. From that date onward, we continued to recommend to our readers to consider gradually “selling high” the stock portion of their long-term portfolio. We did not anticipate though how low stocks would go and how fast it dropped. The magnitude and speed of last week’s drop certainly took everyone by surprise. The Wall Street Journal’s main headline this morning was “Stocks were soaring. What happened?” Stocks are certainly in a Down Trend now. The question is how long will this Down Trend last and how low will it go? For that we offer to you the following chart. This is $SPX weekly chart from 2015 until now. It shows some key resistance levels for $SPX to surpass during the upcoming bounce. It also shows the key support levels that $SPX will continue to retest on when the Down Trend resumes again. To view the charts, read the full article which covers: Short-term Support & Resistance Levels
Market Internal Indicators
Market internal indicators give us a daily glimpse into the short-term direction of the market. Trading Plan
Subscribe to read the full article. |
Archives
July 2024
Categories |
 RSS Feed
|
|
Copyright (c) 2019-2024 LOOK Systems LLC
All rights reserved. |