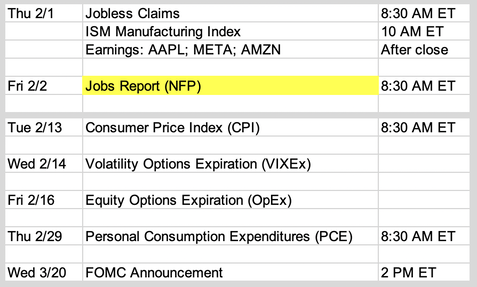
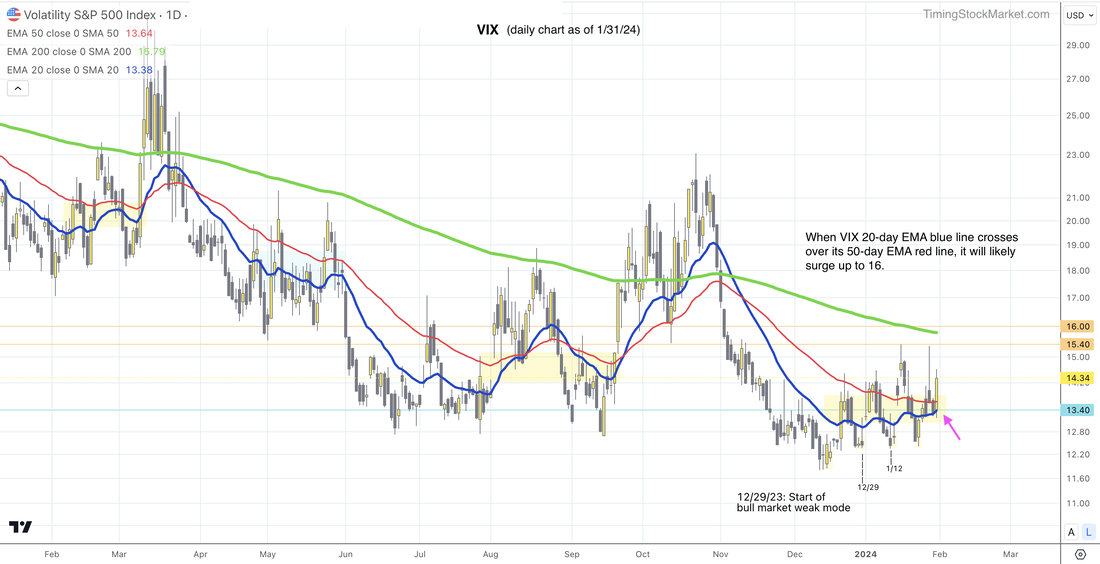
Updates 4 PM ET - Thursday Entered into SOXL NQ failed to drop to test support at 17000 today. We used this fail signal as the new signal to enter long via SOXL. Updates 2:35 AM ET - Thursday Upcoming key events The Fed feels it will be appropriate to begin cutting rates some time later this year. But first they need more evident that inflation will continue to drop and eventually get back to 2%. For now rates remain unchanged and QT remains unchanged. QRA was a non-event. Read more about rates and the economy here. Big picture: bull market; short term: weakening momentum The indicators are still sending out the same message. This is a bull market with weakening momentum, with more selling than buying right now. However the indicators are not showing that this is the start of a bear market. So at some point soon the strong momentum should resume, just not this week. S&P and Nasdaq Advance-Decline Percents (Stockcharts $SPX ADP $NDXADP) are both showing lower high topping patterns on their daily chart. This declining market breadth is now reflected in declining price for ES NQ RTY. VIX daily chart below shows its 20-day EMA blue line about to rise above its 50-day EMA red line. This will likely push VIX up to 16, possibly 17. This supports the current sell mode for ES NQ RTY. Key S/R levels NQ: NQ did not tag any key resistance levels on Wednesday. Instead it dropped sharply after FOMC. While NQ may quickly tag 17450 on Thursday, it is likely to keep dropping, down to 17000 by Friday. Then we may see some basing at that level, followed by a bounce from there back up to 17800 next week. ES: Similar to NQ, ES did not tag its Jan 29 high on Wednesday. Instead it dropped sharply after FOMC. While ES may quickly tag 4905 on Thursday, it is likely to keep dropping, down to 4820 by Friday. Then we may see some basing at that level, followed by a bounce from there back up to 4954 next week. RTY: RTY did manage to get close to its Jan 29 high on Wednesday after FOMC. Then it dropped sharply. While RTY may quickly tag 1990 on Thursday, it is likely to keep dropping, down to 1925 by Friday. Then we may see some basing at that level, followed by a bounce from there back up to 2025 next week. Our personal trade plan We scaled into half SQQQ position, with plans to add the remainng half at open on Thursday. See updated positions and buy target here. Disclaimer The information presented here is our own personal opinion. Consider it as food for thought. We are not offering financial advice. We are not promoting any financial products. We are not registered financial advisers or licensed brokers. We make no guarantee that anything will unfold according to our projections. You are proceeding at your own risk if you follow our trades.
0 Comments
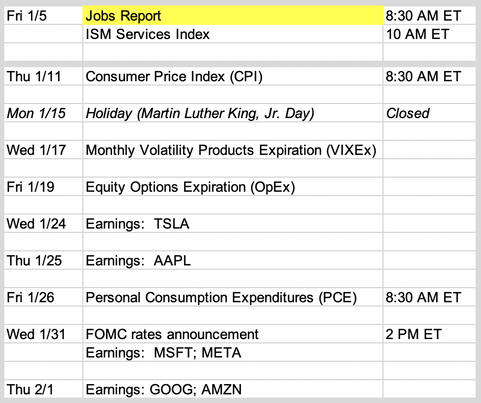
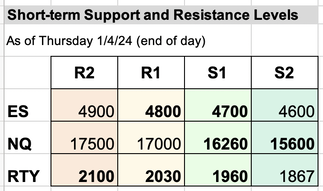
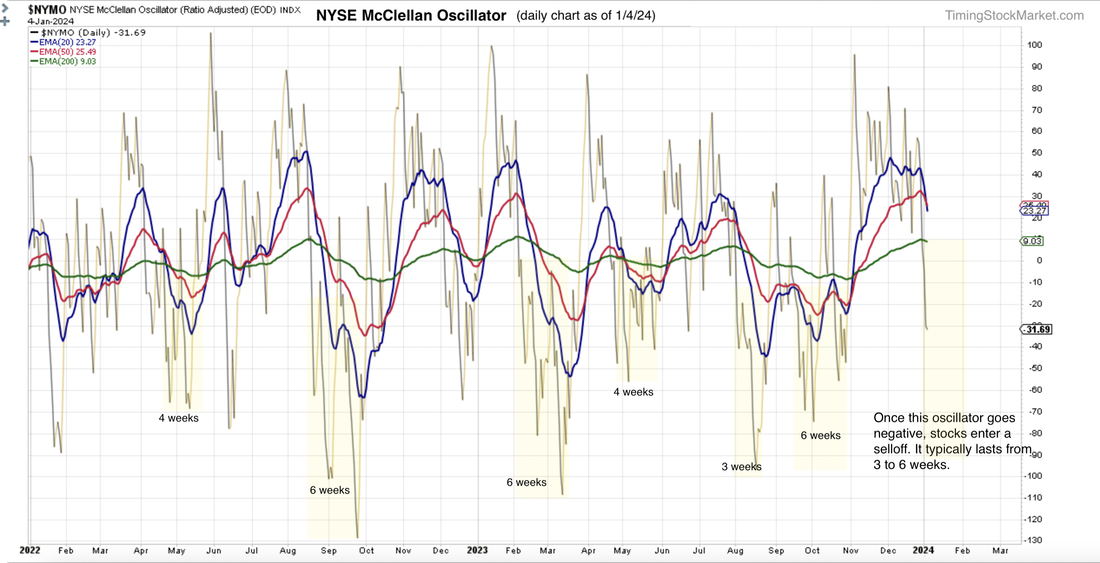
Updates 1:30 AM ET - Friday Upcoming key events Jobs report is likely to bring about a relief bounce for ES NQ RTY. Read more economic analysis here. Key S/R levels Most levels have been lowered to reflect the scope of the selloff. Expect a moderate selloff after a quick bounce to retest R1 In the big picture context, current market is still in a bull trend. However, as we've been sharing with you, ES NQ RTY are starting a moderate selloff, a big dip within the bull trend. ES NQ RTY have been dropping since Dec 29, and are rapidly approaching the new lower S1 levels. After 5 days of selling, they are likely to bounce back up to retest resistance at the new R1. The job report may provide the catalyst for this bounce. The bounce is unlikely to last for very long. ES NQ RTY are unlikely to rise above resistance at R1. After that ES NQ RTY are very likely to resume the drop, which may go all the way to support level at S2. This selloff is likely to last until after FOMC on January 31. After that we are likely to see the big-picture bull trend resumes. How did we arrive at this projection? Based on the indicators below. Market breadth has dropped sharply We've been sharing with you about McClellan Oscillator (Stockcharts.com $NYMO) which measures market breadth. We wrote that once this oscillator turns negative, it will launch a selloff period. This oscillator has dropped to below zero since Jan 2, and has been dropping sharply since. This indicates that selling momentum has picked up substantially, and market is now in a moderate selloff period. The sell period typically lasts from 3 to 6 weeks, as highlighted in yellow below. This is why we project that the current sell period will likely last until FOMC on January 31. VIX VVIX and VIX futures are all rising VIX VVIX and VIX futures intraday charts have formed W bottom patterns. They are all rising in a tightly coiling pattern, indicating more selling is to come. VIX may dip a bit while ES NQ RTY bounce, but it will resume the climb and will pick up speed once ES NQ RTY reach resistance at R1. If VIX spikes up to the zone 16 - 16.5, ES NQ RTY are likely to drop all the way down to support at S2. Rate rises as junk bonds formed a top 10-year Treasury yield (US10Y) has been rising since Dec 27. Junk bonds (JNK) has been forming a clear top on its daily chart. They confirm the selloff. Our personal trade plan VIX has been coiling too much, making it difficult to successfully trade UVXY. So we have new buy orders to enter TZA instead to capture the selloff. We want to capture the drop in RTY from 2030 (R1) to 1867 (S2) Click here for Signal Trades spreadsheet. Disclaimer The information presented here is our own personal opinion. Consider it as food for thought. We are not offering financial advice. We are not promoting any financial products. We are not registered financial advisers or licensed brokers. We make no guarantee that anything will unfold according to our projections. You are proceeding at your own risk if you follow our trades. |
Archives
July 2024
Categories |

 RSS Feed