Updates 2:45 AM ET - Monday Upcoming key events This week is light on economic news, but Powell is scheduled to speak twice at two different economic conferences. Given the latest softer jobs report, traders are likely to monitor his remarks closely for any hints of "no more rate raises". As we know, the stock market is currently driven by bond yields. According to WSJ: "Yields, which fall when bond prices rise, were also pulled lower by soft economic dataand hints from the Federal Reserve that it likely won’t raise interest rates again this year. But it was the Treasury move that many saw as the crucial catalyst." What is this Treasury move and what about the soft economic data? Read more here. 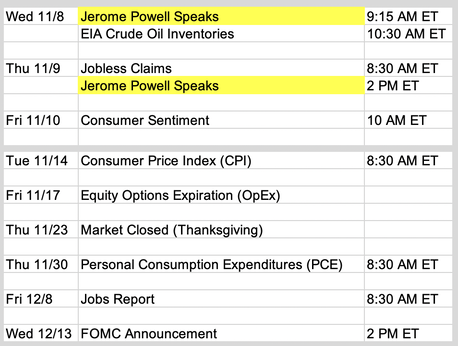 Is the bear market trend done? The WSJ article pointed out that Treasury yields dropped last week from:
Market breadth (Stockcharts.com $SPXA200R $NDXA200R) continues to show big-picture bearishness. The weekly chart of S&P percent below shows all of its EMA lines to dropping sharply. 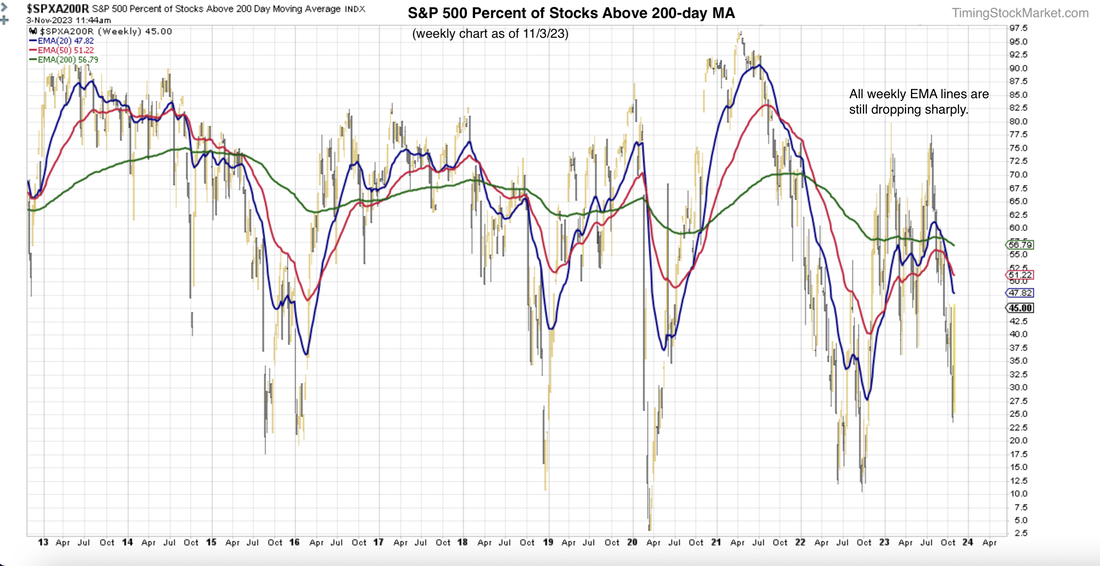 Bounce has lasted 6 trading days. How much longer can it last? The hourly chart of Nasdaq Advance-Decline Percent below shows that it has reached into very overbought category. But it has not formed a top yet. The same is true for S&P A/D Percent chart. We want to see some kind of top formation like August 30 - September 1 top formation shown below. This chart is just starting a possible topping process. Bears should give it time. Wait at least until the 20-hour EMA green line crosses below the 50-hour EMA red line. 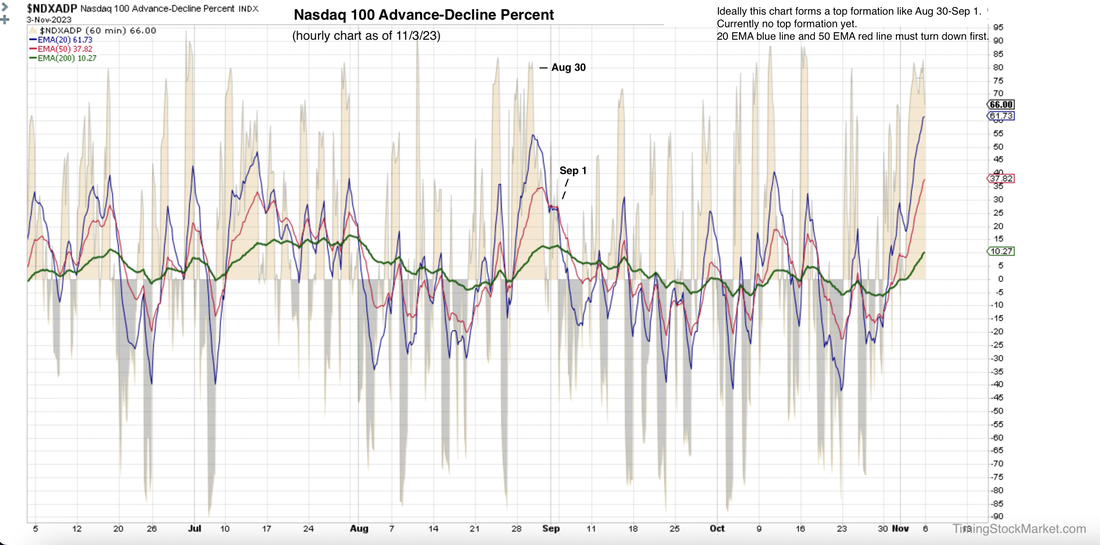 The daily chart of VVIX (volatility of VIX) shows that it has dropped into the bottoming zone. But it is only starting to form the bottom. It can take up to 2 weeks before it's done with the process. So again, bears should wait until VVIX 20-day EMA blue line drops below its 200-day EMA green line and gets down closer to its candles. 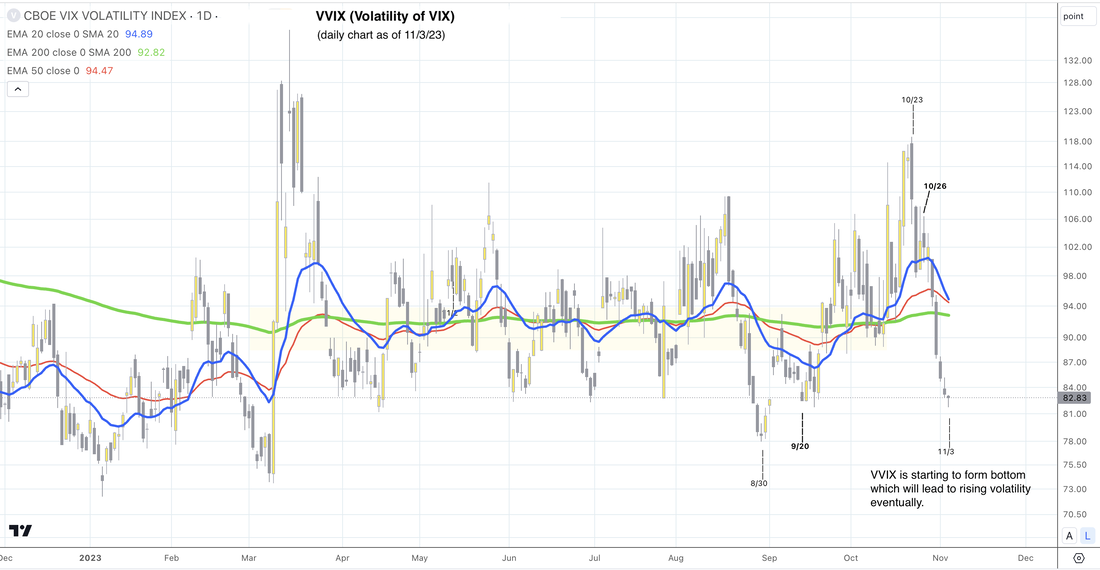 Bear market has a way of luring bulls in with its big sharp bullish reversals. These very sharp rises typically come from massive short covering by dealers who previously sold puts (bullish) and had to short stock futures (bearish) to balance their books. When the buying starts, these dealers have to unload the massive inventory of shorts. The result is a short squeeze. The way to trade this market is to trade the bear market selloff, and trade the relief bounce, but don't get married to either direction. You don't have to buy into the "bear market" label. Just trade the big swings. Key S/R levels The updated levels are shown in bold. Bulls will actually want to see ES NQ RTY retest S1 again, and find strong support. In that case, the setup may bring in enough buyers to send ES NQ RTY up to R2, or possibly higher. If ES NQ RTY try to surpass R1 quickly, they are likely to fail and it will be a steep drop down to S2. 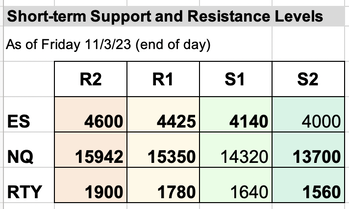 Our personal trade plan Subscribe to get our daily analysis, trade plans and real-time entries/exits. Disclaimer The information presented here is our own personal opinion. Consider it as food for thought. We are not offering financial advice. We are not promoting any financial products. We are not registered financial advisers or licensed brokers. We make no guarantee that anything will unfold according to our projections. You are proceeding at your own risk if you follow our trades.
0 Comments
|
Archives
July 2024
Categories |
 RSS Feed
|
|
Copyright (c) 2019-2024 LOOK Systems LLC
All rights reserved. |