Updates 1:53 PM ET - Tuesday 11/15/22 Stopped out of TNA runner position Per explanation at 10:01 AM below, we tightened the stop on our TNA runner position and got stopped out. We locked in close to 12% profit in 4 trading days (since last Thursday). We are in cash 100% right now and waiting for $VIX and market breadth to reveal the next major move. This next major move is unlikely to happen until this OpEx Friday or Monday. 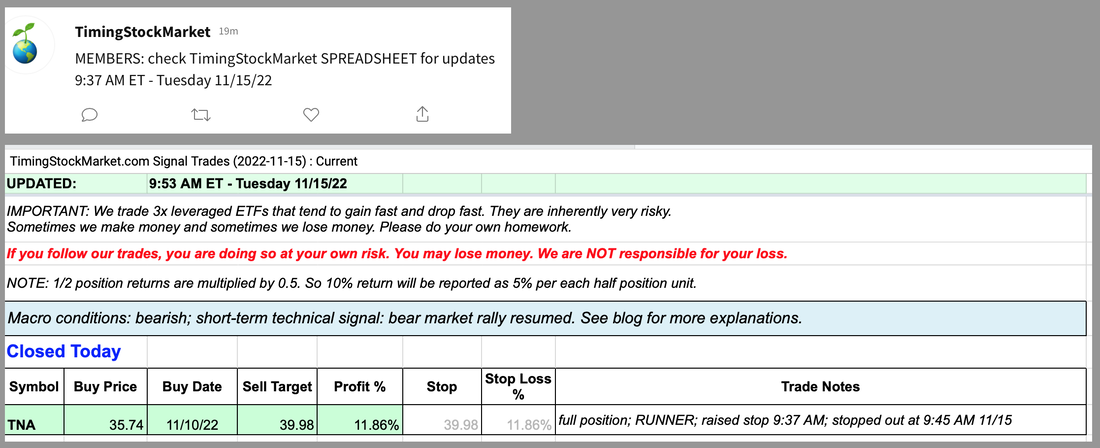 Updates 10:01 AM ET - Tuesday 11/15/22 $VIX EMAs are starting to go sideway This morning's Producer Price Index report (PPI) was cooler than expected. This confirms the direction of the CPI report from November 10. ES NQ RTY all spiked up sharply, but not as enthusiastically as they did post CPI. $VIX hourly chart shows the start of a sideway pattern, the bearish one that we discussed further below. $VIX 20-hour and 50-hour EMA lines are starting to go sideway. This is cause for concern, so we tightened the stop on our TNA runner position. We sent out alert for this right after open. Our position has been stopped out for now. We are going to continue monitoring for further development in $VIX patterns, but no jumping in right now. Updates 12 AM ET - Tuesday 11/15/22 Market breadth Market breadth is still on the high side, but their chart patterns suggest that a pullback is possible this week for ES NQ RTY. $VIX In $VIX hourly chart below we have explained the 2 sets of patterns we are looking for that provide either a bullish setup, or a bearish setup (for stocks) to trade with. You've seen these explanations before. Here they are again because they are very important. We have observed that these patterns do have a tendency to show up during the week of OpEx.
Right now, we don't have either pattern forming just yet. So we plan to just wait and let $VIX chart reveals where market is going next. 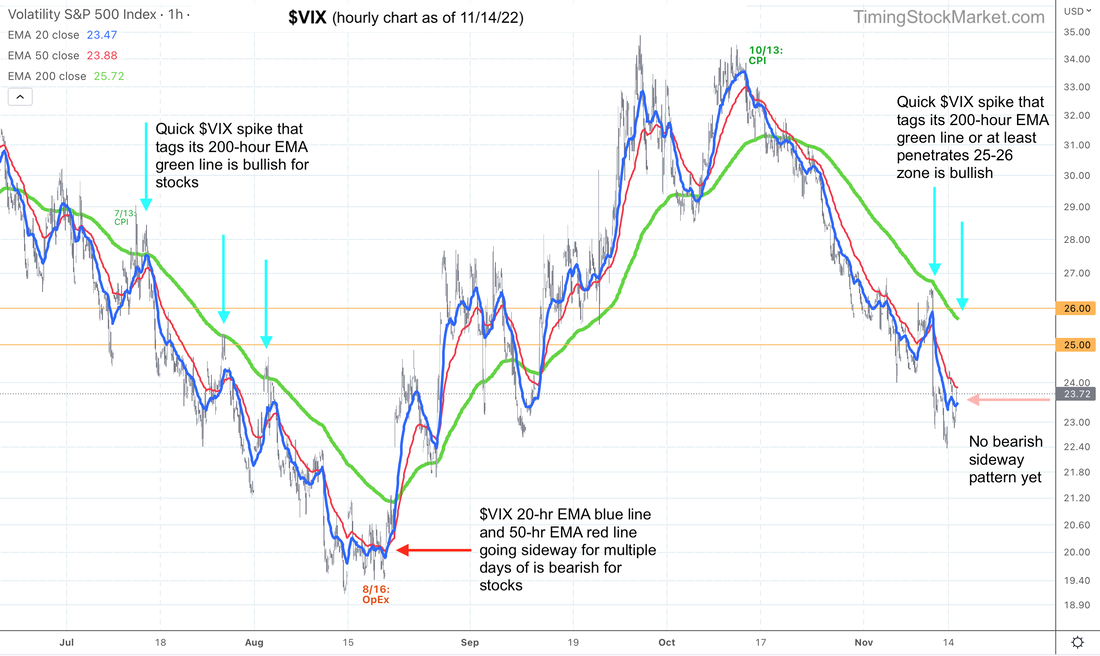 Key S/R Levels The S/R levels are still the same as Monday. ES NQ RTY are in consolidation mode, hovering at the bottom of their R1-R2 resistance zone. Again, whether they will successfully rise up to R2 or not will depend on how $VIX pattern evolves as explained above. 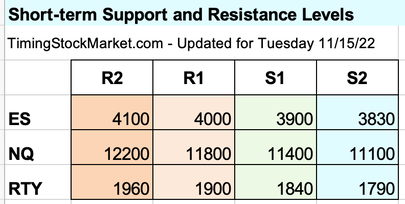 Trade Plan It is still our goal to re-enter TNA swing position, but we will wait for the bullish quick $VIX spike described above as the low-risk setup to trade with. Note that if we start observing the bearish sideway pattern described above, we will manually exit TNA runner. Subscribe to get our latest analysis, daily trade plans and live intraday trades. Current trade record here. Disclaimer The information presented here is our own personal opinion. Consider it as food for thought. We are not offering financial advice. We are not promoting any financial products. We are not registered financial advisers or licensed brokers. We make no guarantee that anything will unfold according to our projections. You are proceeding at your own risk if you follow our trades.
0 Comments
Updates 1:53 PM ET - Thursday 11/10/22 Entered TNA post CPI Last night we showed you specifically what to look for on $VIX chart immediately post CPI to know if it's a real bullish move or a head fake in ES NQ RTY prices. Specifically, we were looking for $VIX 20 EMA blue line to drop below its 200 EMA green line (30-minute chart). That's exactly what we got immediately post CPI. So we were confident in scaling into our bull targets (TNA runner and TNA swing positions), and we alerted you to do so. We tightened the stop on our TNA swing position to lock in partial profit. ES NQ RTY are overbought right now and the probability of a pullback is high. So we want to ensure that we get some profit out of this trade attempt. The runner position is still intact and may achieve the target profit of close to 26%. We do plan on re-entering TNA swing or possibly TQQQ swing, depending on the setup tomorrow. We will discuss the setups that we are looking for in tonight's post. 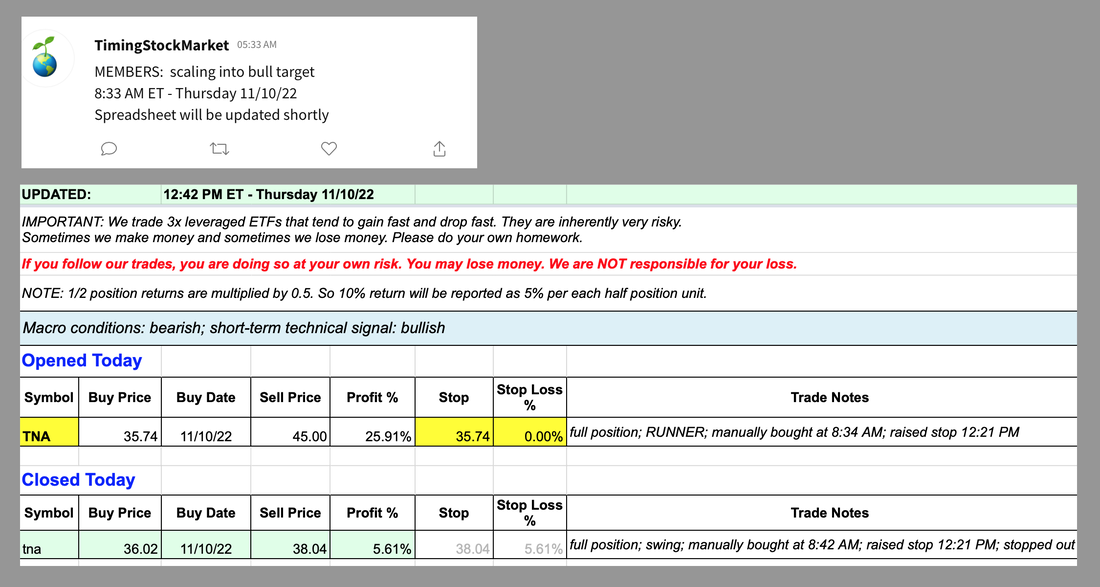 Updates 12:45 AM ET - Thursday 11/10/22 Market breadth Market breadth charts are not helpful right now as they are forming short-term tops. These short-term tops are not super reliable as signal for a bearish pivot in stocks. They are simply indicating a pullback is coming, not necessarily a change in trend. Furthermore, we will not be able to get intraday breadth data immediately post CPI because it's released pre-market at 8:30 AM ET. Watch out for traps Keep in mind that post CPI, price actions on ES NQ RTY charts can easily become head fakes. Recall the big price drop and big reversal immediately post CPI on Oct 13. That was such a big bear trap that we would have fallen into if we simply had focused on price actions alone. Focus on volatility Instead we had good results on Oct 13 because we focused closely on volatility charts. $VVIX: While it may be concerning to look at $VVIX sharp spikes from Tuesday and Wednesday, it is actually not as scary as it looks. The time to worry is when $VVIX candles contract, and most importantly when its 20-day EMA blue line gets very close to and is about to cross over its 50-day EMA red line. (See red arrows below). When $VVIX candles rise sharply for a few days in a row, they typically peter out to form a top, especially and they tag or cross above the 200-day EMA green line. (See green arrows below.) This is why we say $VVIX chart is actually not super scary or bearish looking right now. It is simply saying $VIX volatility has risen. This is to be expected, as traders buy protective puts ahead of CPI. 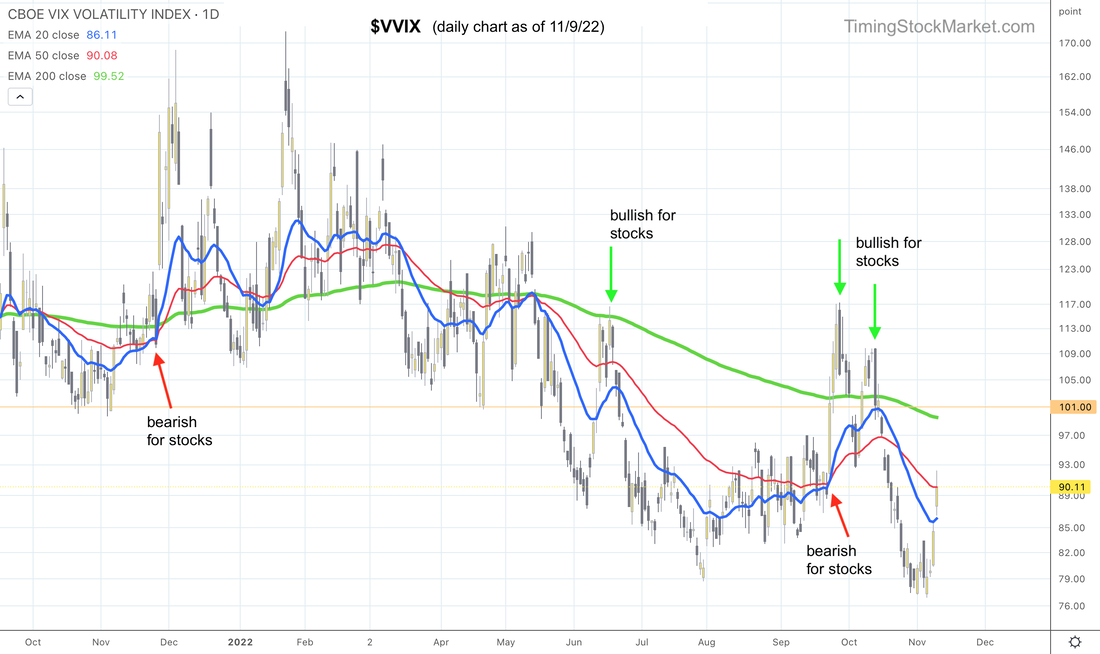 $VIX While we are leaning a bit bullish with $VVIX chart, we are waiting for $VIX chart actions post CPI to decide which way to go. Take a careful look at $VIX chart annotations below. (This is $VIX 30-minute chart.) 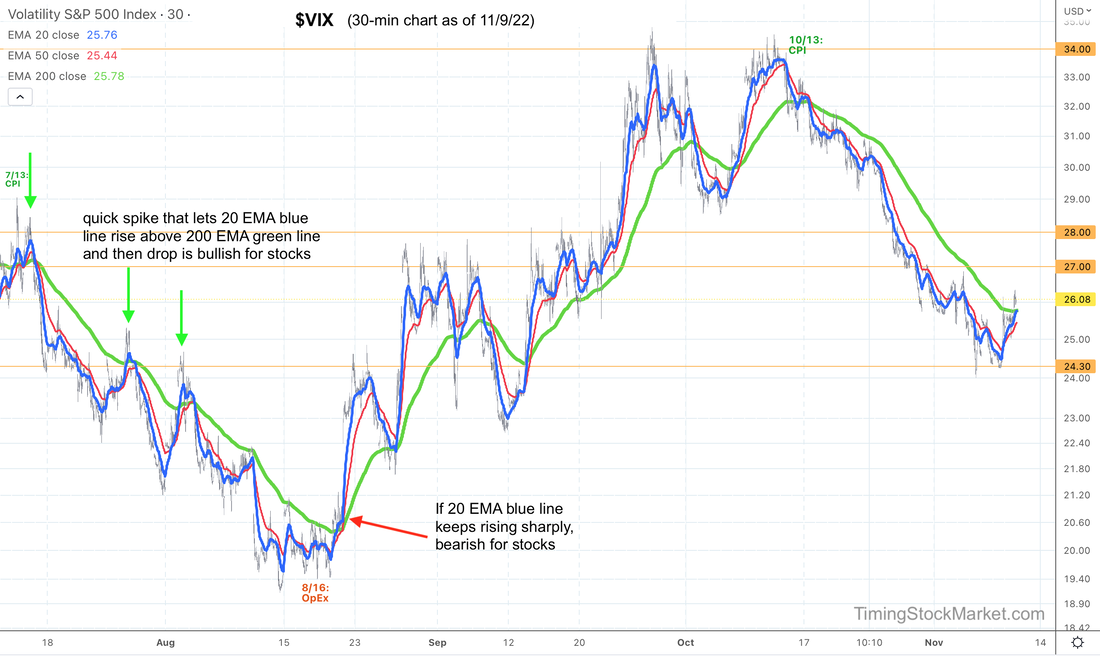 Understanding what's behind the $VIX patterns Ahead of CPI report, traders have loaded up on protective puts. This is among the reasons for the spike in $VIX and $VVIX. If traders choose to cash out these puts right after the report, $VIX will quickly drop. And as these puts are closed, dealers will need to cover their own short positions (usually in equity futures) to keep their books non-directional. The result is likely to be a short squeeze which is bullish for stocks. On the other hand, if traders panic, they will add more puts which will raise volatility very quickly, as reflected in $VIX. At the same time, dealers who just sold puts will have to short equity futures to balance their holdings. The result is likely to be a long squeeze which is bearish for stocks. Key S/R levels The S/R table below is the same as yesterday. We think that S2 is going to be retested post CPI. If $VIX drops, S2 may hold. If $VIX rises, S2 will fail. 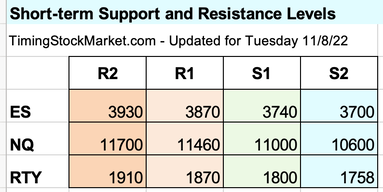 Trade Plan We had a buy order for TNA at 32.7 on Wednesday in our shared spreadsheet. TNA tagged 32.7 by end of Wednesday and we could have placed the buy order as price approached that level. But it was simply too late in the day to enter any position. Our strategy is to wait. Rather than placing our bets based on price levels alone, we are going to wait for signals from $VIX to confirm as described above. So the actual entry price may be different than the price in the spreadsheet, but that is the level we are targeting. Subscribe to get our latest analysis, daily trade plans and live intraday trades. Current trade record here. Disclaimer The information presented here is our own personal opinion. Consider it as food for thought. We are not offering financial advice. We are not promoting any financial products. We are not registered financial advisers or licensed brokers. We make no guarantee that anything will unfold according to our projections. You are proceeding at your own risk if you follow our trades. |
Archives
July 2024
Categories |
 RSS Feed
|
|
Copyright (c) 2019-2024 LOOK Systems LLC
All rights reserved. |