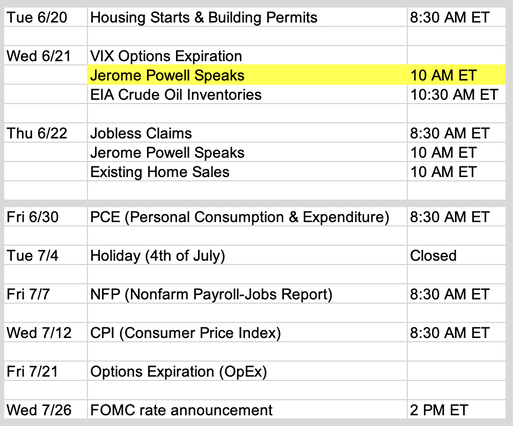
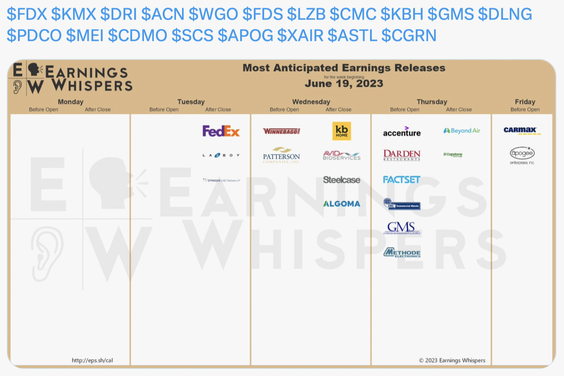
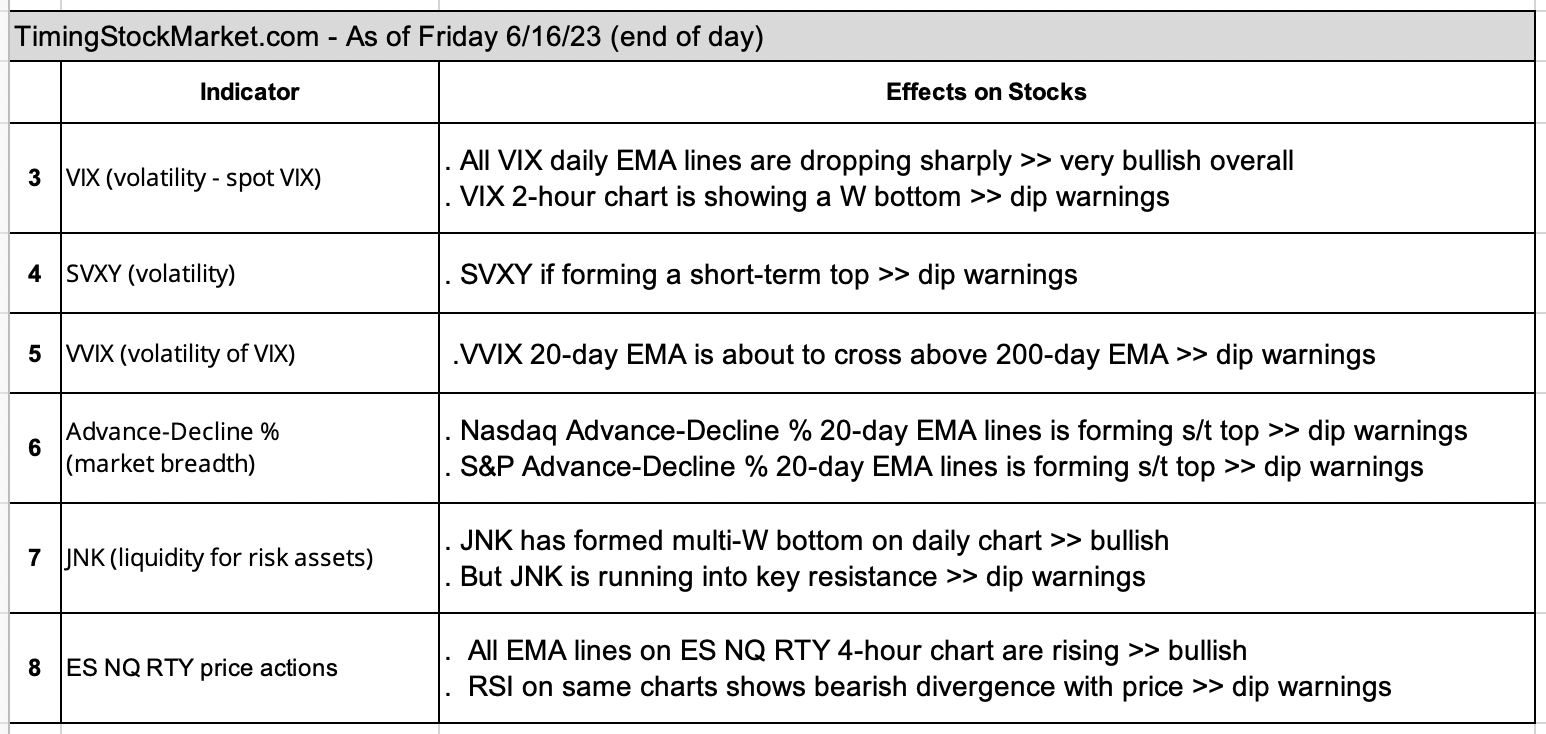
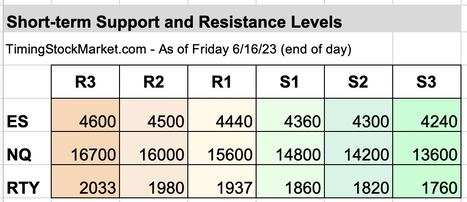
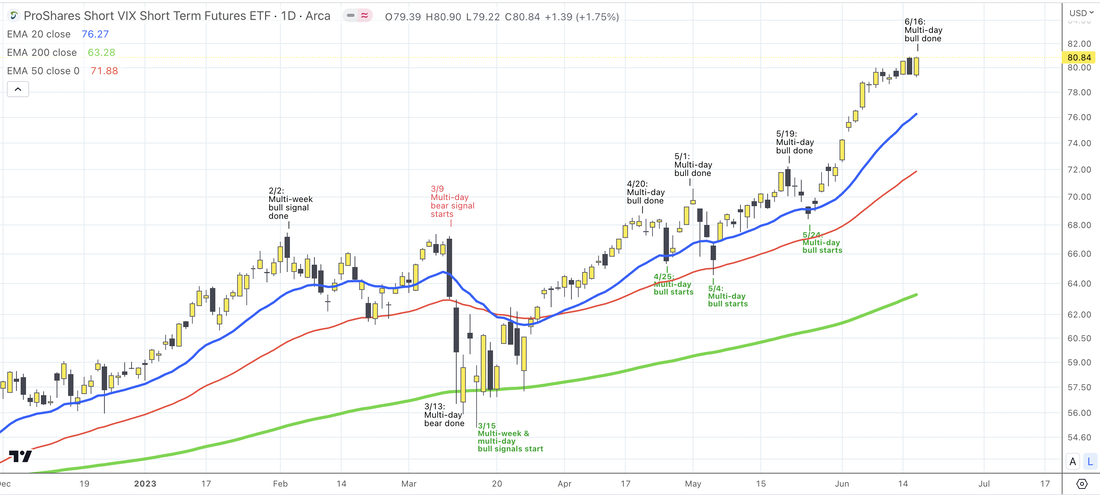
Updates 2 PM ET - Monday Upcoming key events There is a moderate amount of market events this week. Powell is scheduled to speak starting on Wednesday in his semiannual report to Congress. Earnings this week Chart courtesy of Earnings Whispers. Multi-week Signal Indicators: Bullish Our two key indicators below tell us that the bull market is still intact. In the big picture context, ES NQ RTY along with SVIX SVXY will remain in bullish trend until both of these indicators below change. If only one indicator changes to bearish, then equities may be transitioning, but they don't turn bearish instantly. Note that when we say "turn bearish" for the multi-week signal, we don't mean just a dip. When these two signals below turn bearish, it means the big-picture multi-month bull trend is done. Market will then transition to some variety of bear market. Multi-day Signal Indicators: Bullish but more dip warnings Background info on $VIX, $VVIX, SVXY, UVXY, ES, NQ RTY While the bull market remains intact, the multi-day indicators are sending out more warnings that a good size dip is very likely this week for ES NQ RTY SVIX SVXY. But this is only a dip that may last 1-2 days. It is not the start of a new bear market. Key S/R levels NQ resistance levels have been updated. All others are the same. VIX and dip levels We want to share SVXY daily chart below to give you an idea of how the multi-day and multi-week signals have been unfolding since Feb 2. Admittedly, our system was not well equipped enough to catch all of the moves. Still we caught some, and used this data to fine tune the model.
We may see some choppy movements ahead of VIX OpEx on Wednesday, but overall we expect to see SVXY SVIX dip and then possibly bottom out in the zone around their 20-day EMA blue line (about 23 for SVIX). As for ES NQ RTY, they are likely to dip and retest S1 before bouncing up higher. Our personal trade plan We currently have buy orders to scale into 2 SVIX positions when it gets down closer to its 20-day EMA blue line. Note that we're scaling in a pretty wide zone from 23.5 down to 22.7. In our experience, detecting the bottom of the dip is not easy. But after a medium dip, SVIX will try to retest the previous high before it drops lower, if it drops at all. Therefore we will hold off setting an immediate stop until SVIX 20-hour EMA line turns up from dipping. MEMBERS: Click here for Signal Trades spreadsheet. We have found that we have to analyze at least 3 time frames to get a feel for key S/R levels that are suitable for a given trade. Disclaimer The information presented here is our own personal opinion. Consider it as food for thought. We are not offering financial advice. We are not promoting any financial products. We are not registered financial advisers or licensed brokers. We make no guarantee that anything will unfold according to our projections. You are proceeding at your own risk if you follow our trades.
0 Comments
|
Archives
July 2024
Categories |

 RSS Feed