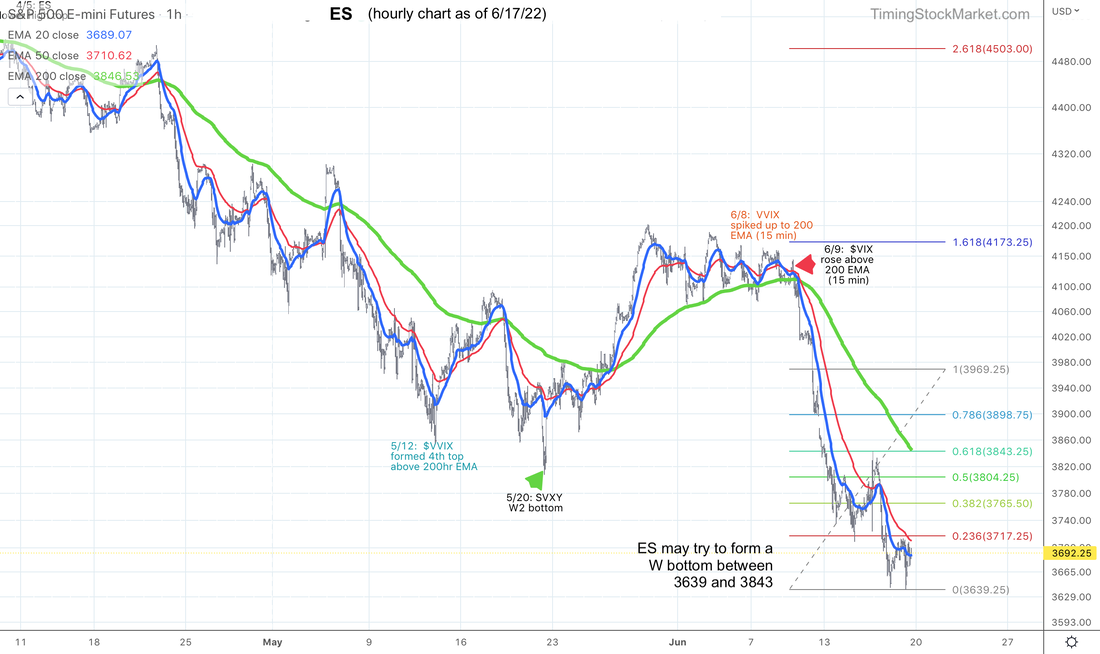
Updates 8:45 PM ET - Sunday Upcoming key events This week brings more economic data to fuel the discussions about inflation, recession and rate raise. Note also that next Monday is 4th of July holiday, and this one will be particularly poignant. 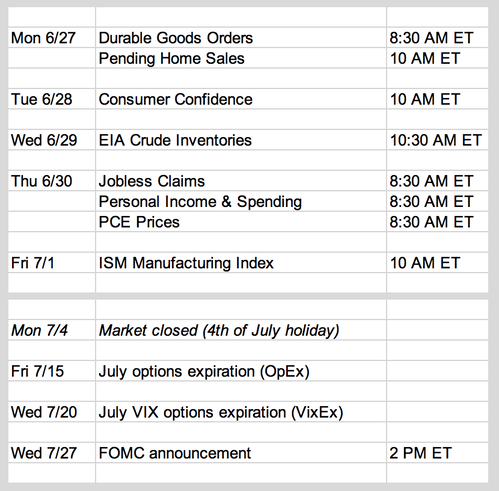 Big picture: Bear market still in pause mode with short-covering rally In the updates for Tuesday 6/21, we wrote that the bear market is not done, but is likely to be getting a respite in the form of a short-covering rally during the week of 6/21. And that is pretty much what happened last week. Big picture: Intermarket indicators show bullish support Intermarket indicators are still supportive of the current rally, as they were last week. 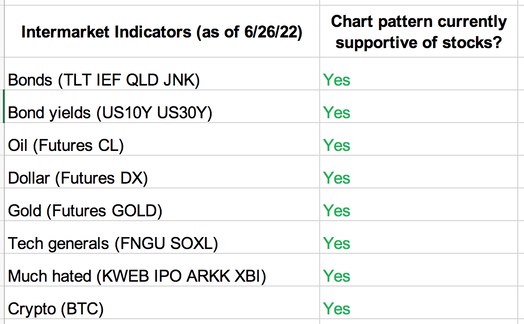 Big picture: Market breadth shows bullish support Market breadth has certainly been improving. The percentage of Nasdaq stocks above the 200-day MA went from a 4% low (week of 6/13) to 18% high (week of 6/20). Similarly, NYSE stocks went from 5% low to 23% high. Also, the weekly chart doji pattern shown below is also bullish. 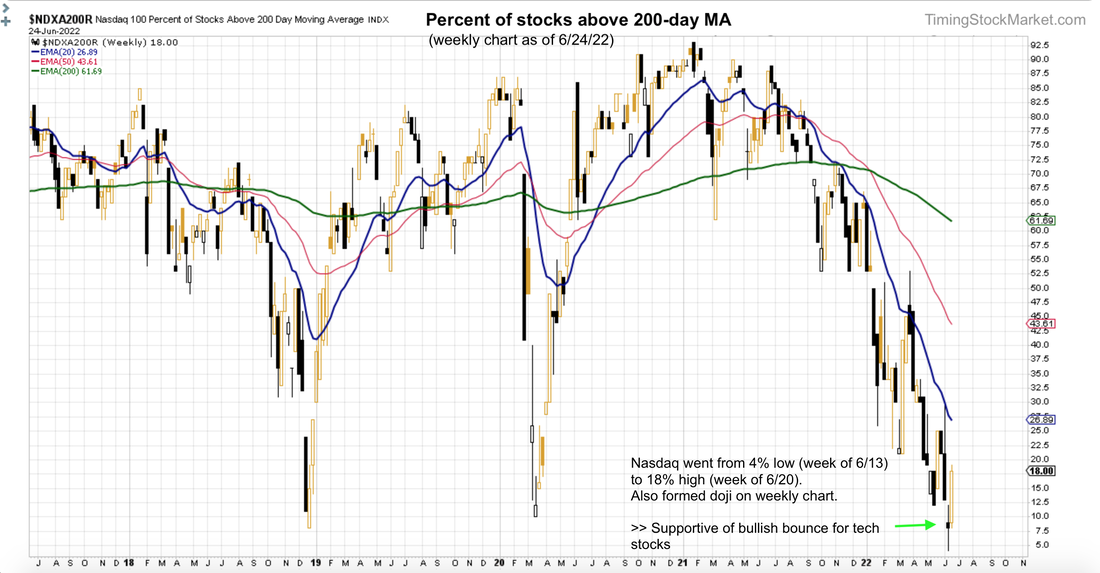 Short-term volatility signal: "Fully Bullish" $VIX is forming a topping pattern. $VVIX is steadily dropping. Both charts are providing bullish support for stocks. 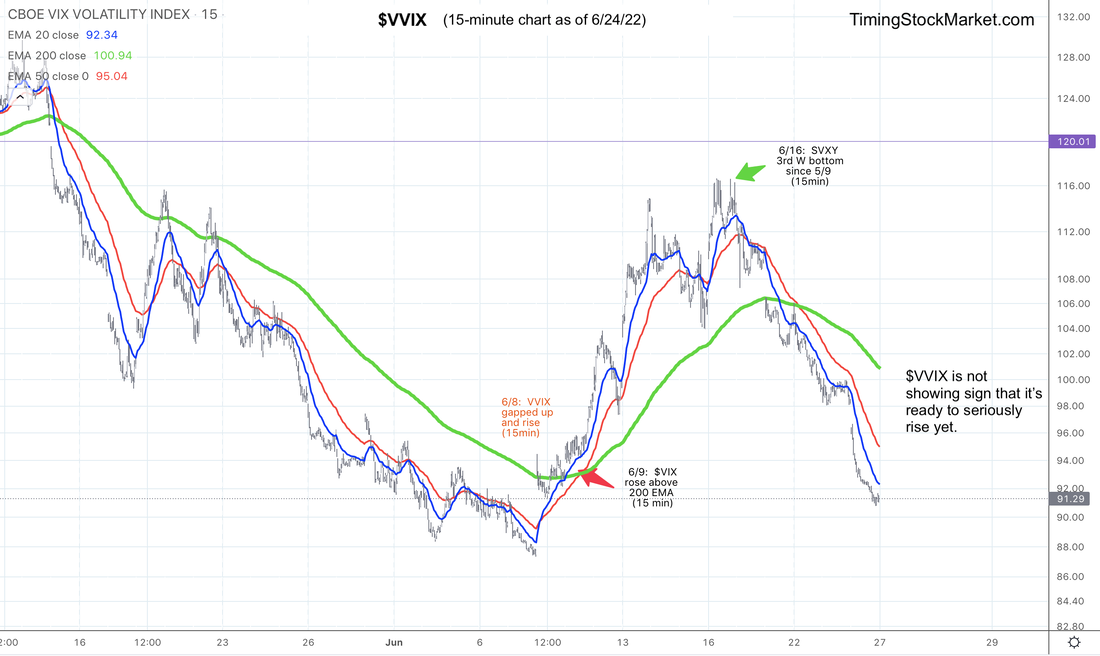 But we should monitor SVXY closely. It formed an evening star candlestick on its daily chart on Friday 6/24. On 5/17, this pattern lead to a drop in SVXY (bearish for stocks). On 5/26, SVXY ignored this pattern and kept marching upward. 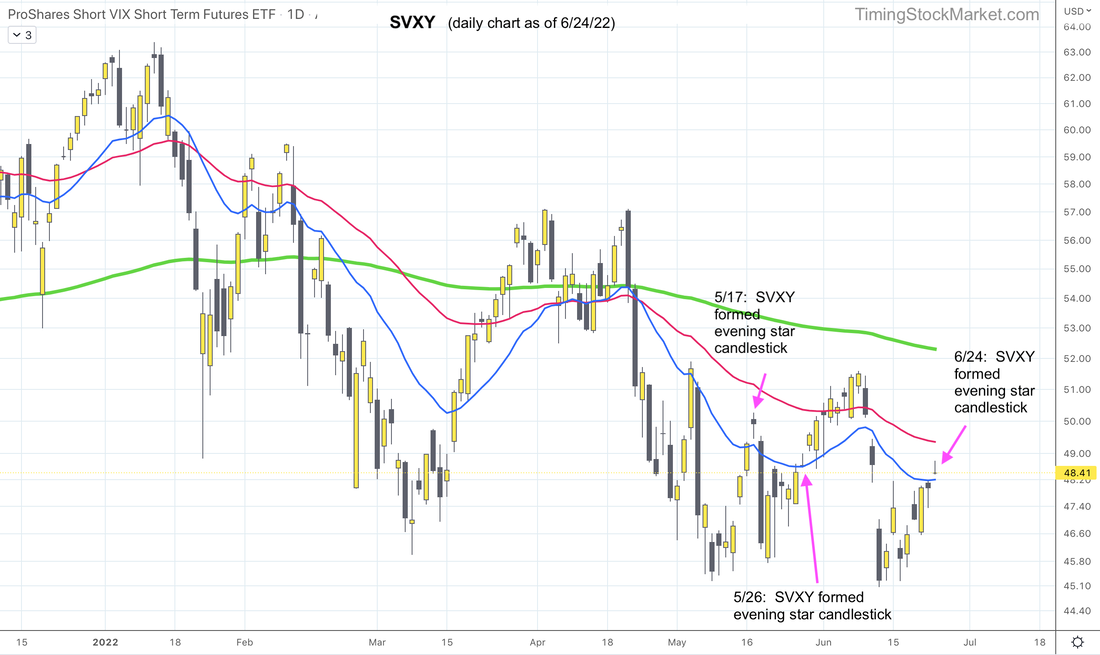 Bear market done? We really don't think so. A lot of puts expired in the last two Fridays, and that accounted for the drive behind the current rally, which started on 6/16. There is end-of-month expiration happening this Thursday 6/30 (for June). There is end-of-week expiration happening this Friday 7/1. As these put options expire, dealers will rebalance their books by covering their stock futures shorts. This is buying into strength, and it fuels very sharp price increase. (See articles explaining this phenomenon here.) While we think it is possible for ES to rise up to 4000 this week, it is likely to run into strong resistance there, and will consolidate for multiple days before breaking out or breaking down. Furthermore, even if the bear market was done, it is extremely unlikely for ES to march straight up (V recovery) without forming a W bottom, or cup-and-saucer pattern near 3639 first. 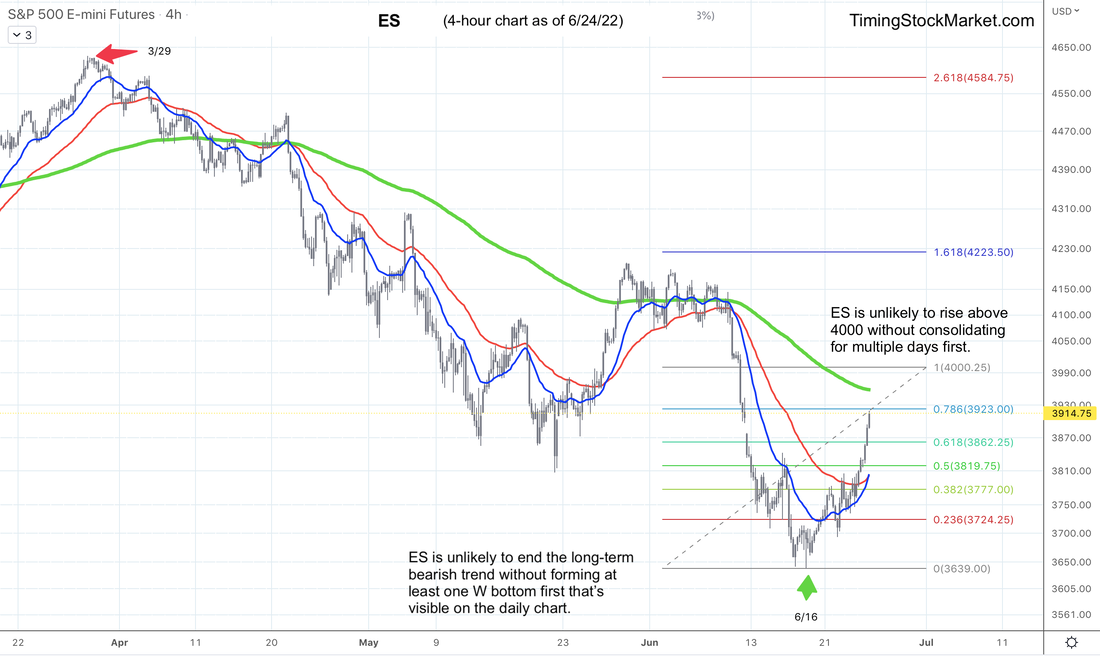 Trade plan Click here for live trades. Subscribe to get our latest analysis, daily trade plans and live intraday trades. Current trade record here. Disclaimer The information presented here is our own personal opinion. Consider it as food for thought. We are not offering financial advice. We are not promoting any financial products. We are not registered financial advisers or licensed brokers. We make no guarantee that anything will unfold according to our projections. You are proceeding at your own risk if you follow our trades.
0 Comments
Updates 12:45 PM ET - Monday Upcoming key events After all the events of last week, market participants were psychologically exhausted going into the long weekend. This coming week is much lighter in economic reports, but Powell is scheduled to speak on Wednesday and Thursday. Some potential fireworks there. 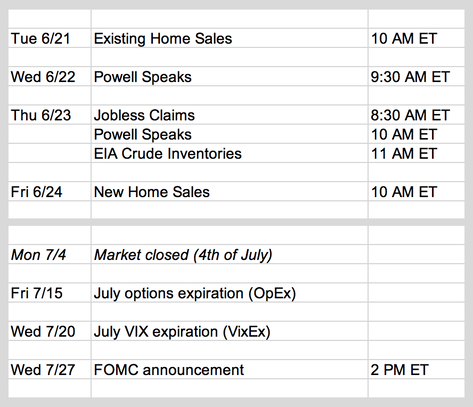 Short-term: Bear market is not done, but it is getting a respite Despite the Fed's latest attempt at soft landing, this bear market is not done yet. But it would appear that there is a bit of a respite happening after the major sell-off right before FOMC last week.
Nasdaq percentage of stocks above 200-day MA dropped as low as 4% last week, before recovering to form a bullish doji on its weekly chart. It closed at 8%, certainly down in the range of capitulation. But the charts are not sending out a clear "capitulated" message just yet. Long term: $SPX to 3000 and then 6000? All of this is very depressing news for most people. But you may cheer at the following projections. One of the most bearish analyst on Wall Street, Michael Hartnett, came out with some interesting predictions for this bear market. Essentially, based on historical data:
Short-term volatility signal: "Transition" Zooming back into the short-term tactical trading perspective, we focus once again on the keeper of the market rhythm: $VVIX, otherwise known as "vol of vol". So far in this bear market, when $VVIX has formed 4 topping spires is when the volatility signal becomes "Approaching Bullish". Then when $VVIX drops below it 200-hour EMA, rises back up and tags this key resistance, volatility signal becomes"Fully Bullish". We don't have that setup with $VVIX yet. $VVIX has only formed 2 spires so far. 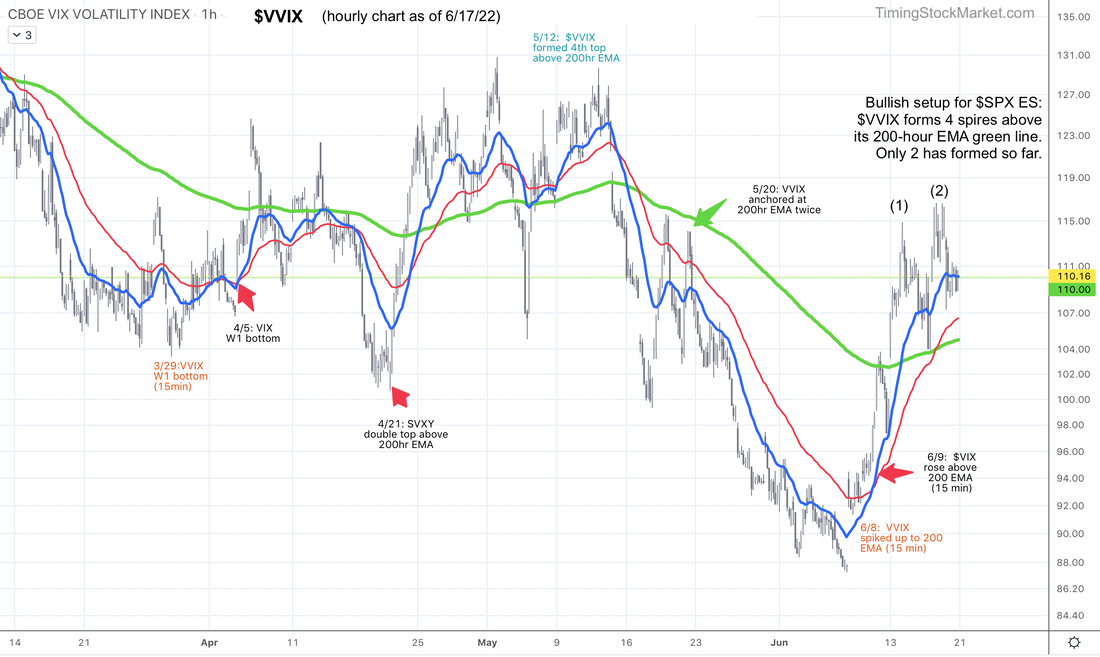 But in case we're wrong about this projection, we are also going to track it via SVXY. 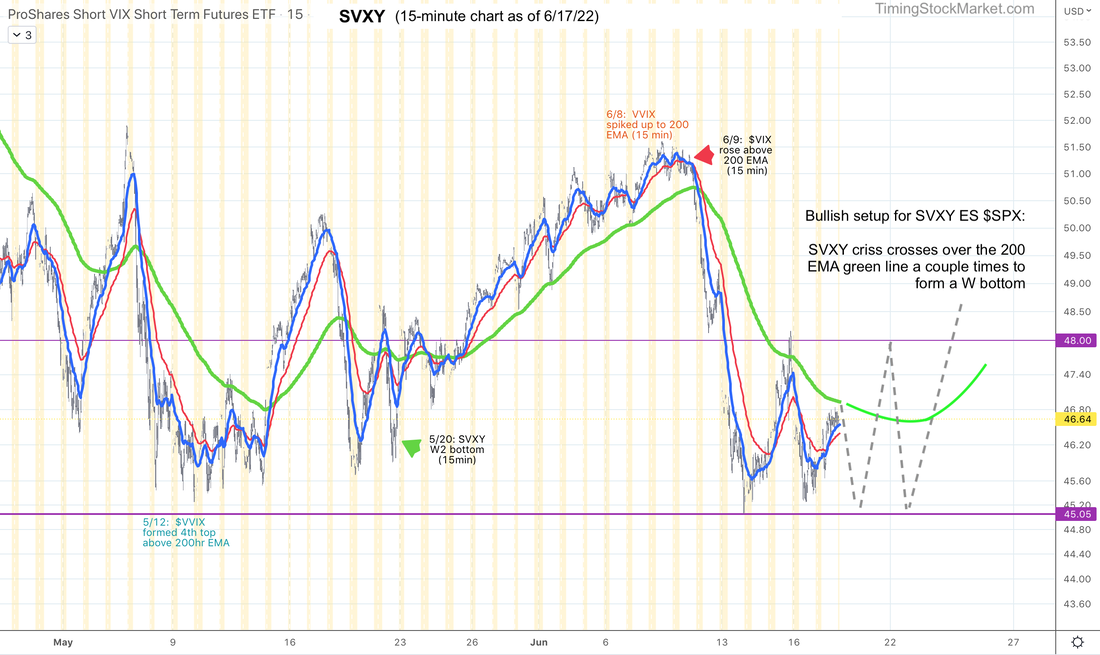 Key S/R levels While SVXY forms W bottom, here are the key S/R levels to monitor.
 Trade plan Click here for live trades. Subscribe to get our latest analysis, daily trade plans and live intraday trades. Current trade record here. Disclaimer The information presented here is our own personal opinion. Consider it as food for thought. We are not offering financial advice. We are not promoting any financial products. We are not registered financial advisers or licensed brokers. We make no guarantee that anything will unfold according to our projections. You are proceeding at your own risk if you follow our trades.
Updates 1:38 PM ET - Wednesday 6/15/22 Short-covering rally starting today... At this point, there is a very high probability that the Fed will raise rate by 0.75 percentage points, and murmur something about being committed to fight inflation. The market has been anticipating this since the Fed floated this idea in WSJ articles in the last few days. And the market's response is likely going to be short-term bullish, evident by volatility forming short-term tops, and stock indices attempting to climb. Post FOMC, we expect to see a quick retest of ES NQ RTY lows from yesterday, followed by a more earnest attempt to climb. In other words, the short-covering rally is going to start early ahead of Friday OpEx. This also means that the rally is likely to be done by Tuesday. (Market is closed Monday for Juneteenth holiday.) Key S/R levels These are going to be key levels for ES:
Trade plan We plan to enter a Quick Bull position to capture this rally, but as the name implies, it will be quick. We still plan to enter Multi-day and Multi-week Bear positions at lower entry price. We'll update spreadsheet shortly. Updates 12:30 AM ET - Wednesday 6/15/22 Bear market sell-off stabilized a bit ahead of FOMC After three days of straight selling, all stock indices stabilized a bit and formed doji candles on their daily charts. As of tonight's writing, they are attempting to climb a bit. But this bear market is not done yet. It has a long way to go still. We are projecting the following levels before we see some kind of real bottoming:
Conditions continue to be bleak for stocks, bonds, and crypto.
Volatility signal: "Fully Bearish" $VIX $VVIX both took a breather on Tuesday. They may be forming temporary tops, but $VVIX will have to form multiple same-high spires above its 200-hour EMA for volatility signal to ease from "Fully Bearish" mode. It is far from this pattern right now. For this reason, we think $VIX can still rise up to 48 before it tops out. What to expect with FOMC As of Tuesday, there were serious indications of the Fed raising rate by 0.75 percentage point instead of 0.5. According to WSJ: “My sense is that the Fed has decided to do 75 basis points rather than 50 basis points because of the data we’ve gotten over the last week or so showing higher inflation and maybe some more disturbing news on inflation expectations,” former New York Fed President William Dudley said. Whether the Fed will actually do it, or just stick to 0.5 remains to be seen. And no one knows for sure if the market will perceive the FOMC announcement as bullish or bearish. On top of this, we have a huge quarterly OpEx on Friday. So we want to lay out a few scenarios below for you to track. Bullish response: market likes what it hears and begins to unload puts right after FOMC, ahead of Friday OpEx. This will start the short-covering rally right away. But because this rally is pulled forward, there will not be much fuel left for the rally to continue after OpEx. Given the 3-day weekend, we think the rally will peter out by Tuesday. Bearish response: market freaks out after FOMC announcement. Selling resumes and keeps going until Friday. Implied volatility ($VIX) jumps due to increased demands for puts. As a result, dealers have to short stock futures even more to keep their books neutral. Dealers in effect will sell into weakness, taking away liquidity and causing huge price drops. This is the stomach-dropping scenario. But on OpEx Friday, a lot of these puts will expire. In response, dealers will cover their shorts, thereby launching a short-covering rally that may last until Wednesday. Keep in mind though that in both scenarios, the rally will not last very long and what comes after is more selling. A lot more selling. Trade plan Click here for live trades. Subscribe to get our latest analysis, daily trade plans and live intraday trades. Current trade record here. Disclaimer The information presented here is our own personal opinion. Consider it as food for thought. We are not offering financial advice. We are not promoting any financial products. We are not registered financial advisers or licensed brokers. We make no guarantee that anything will unfold according to our projections. You are proceeding at your own risk if you follow our trades.
Updates 12 AM ET - Monday 6/6/22 Upcoming key events The CPI report on Friday will be closely monitored as it comes right before FOMC announcement on 6/15. The week of 6/13 will be a fairly explosive week, followed by a 3-day weekend. So mark your calendar not to go on vacation during that week. 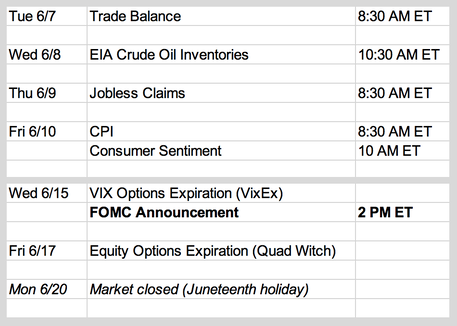 Bear market is closer to the end than to the beginning Take a look at the weekly chart of Nasdaq percentage of stocks above 200-day MA. This percentage is the worst among all the stock indices. But it is in the process of forming a bottom. As long as this percentage can stay above its recent low of 12%, the bottom becomes stronger. And if this percentage dives below 10%, that is historically capitulation area. 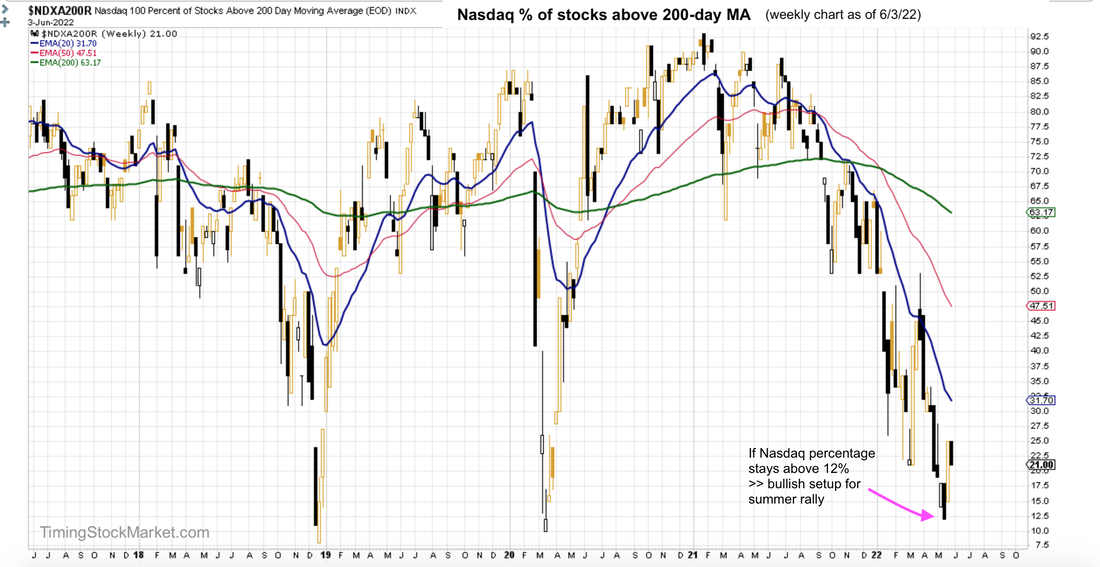 OpEx week can lead into big summer rally The upcoming OpEx on 6/17 is very very big. Over $3.2 trillion in options are set to expire, and the majority of them are put options. Traders and portfolio managers have been purchasing massive amount of puts to hedge against the drop in stock prices. When a trader buys puts, a dealer is selling it from his book. To keep his book neutral from the direction of the market, the dealer has to hedge. He typically hedges against his sold puts (bullish) buy shorting stock futures (bearish). When these puts expire or are monetized by traders, dealers have to cover their shorts to stay market neutral. The result is a short covering rally because dealers are now buying into strength. Their buying raises stock prices, prompting traders to sell more puts, which then forces dealers to cover more shorts. And a virtuous cycle starts for the bulls. Imagine over $3.2 trillion options, most of which are puts, expiring on 6/17. The resulting short squeeze can trigger a massive rally that may last multiple weeks into the summer. Read more about how options are impacting the underlying stock market here. 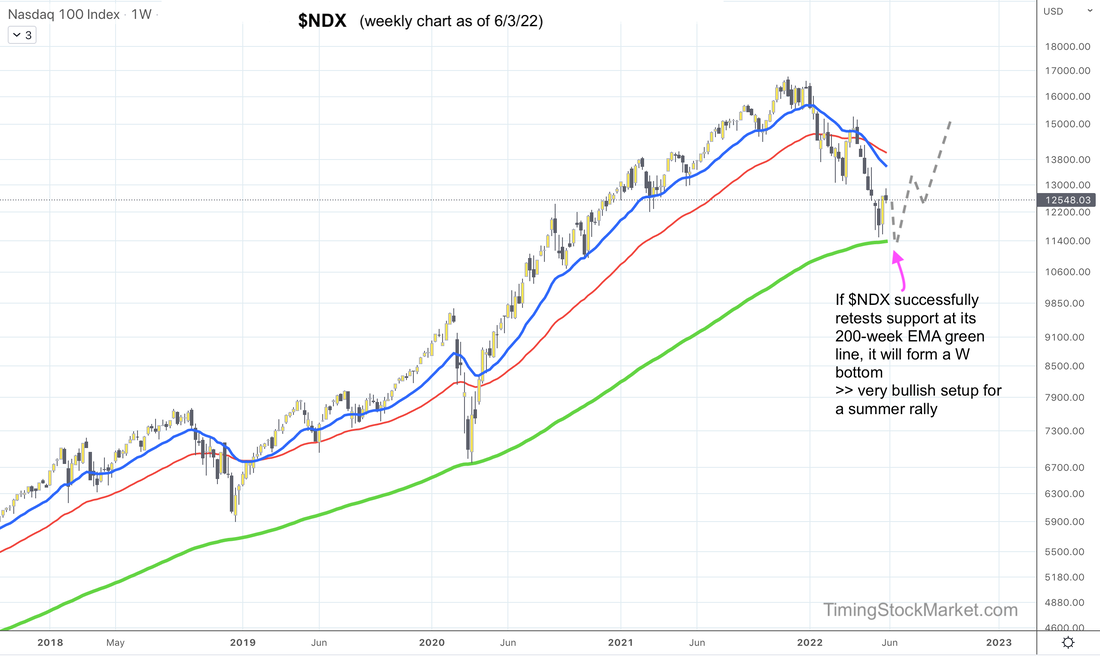 Short-term volatility signal: "Transition" However, before we get there we may have to endure another week of choppy or slightly bearish trade actions. $VVIX is hinting that it is getting ready to rise, at least back up to the zone between 106 and 110 (20-day and 50-day EMA lines). As $VVIX rises, stock prices are likely to drop some amount. So we should be prepared for choppy to bearish price actions. Read more about volatility and volatility ETFs here. 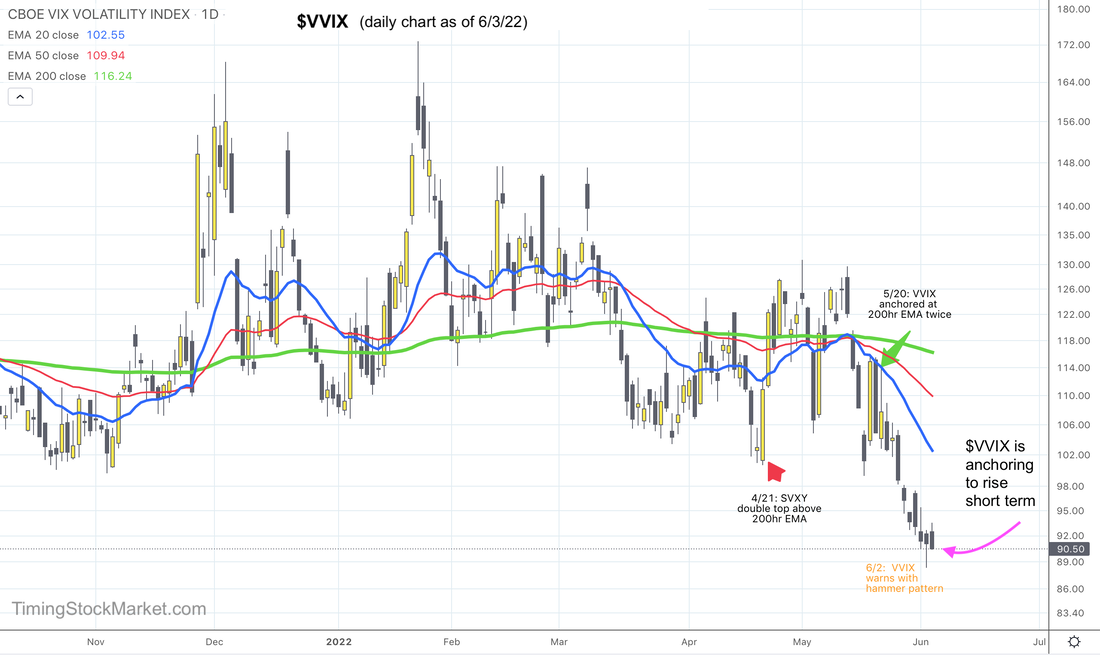 Key support and resistance levels Given the likely choppy market conditions, we are looking at tight trading ranges to start the week
Between now and 6/17, we should be prepared for price actions similar to the period between 2/24 and 3/15. Recall that March FOMC was on 3/16, and March OpEx was on 3/18. And similar to June, March OpEx was the end of the first quarter, and was quadruple witching as well. And the stock market turned bullish on 3/15, right before all these key dates. 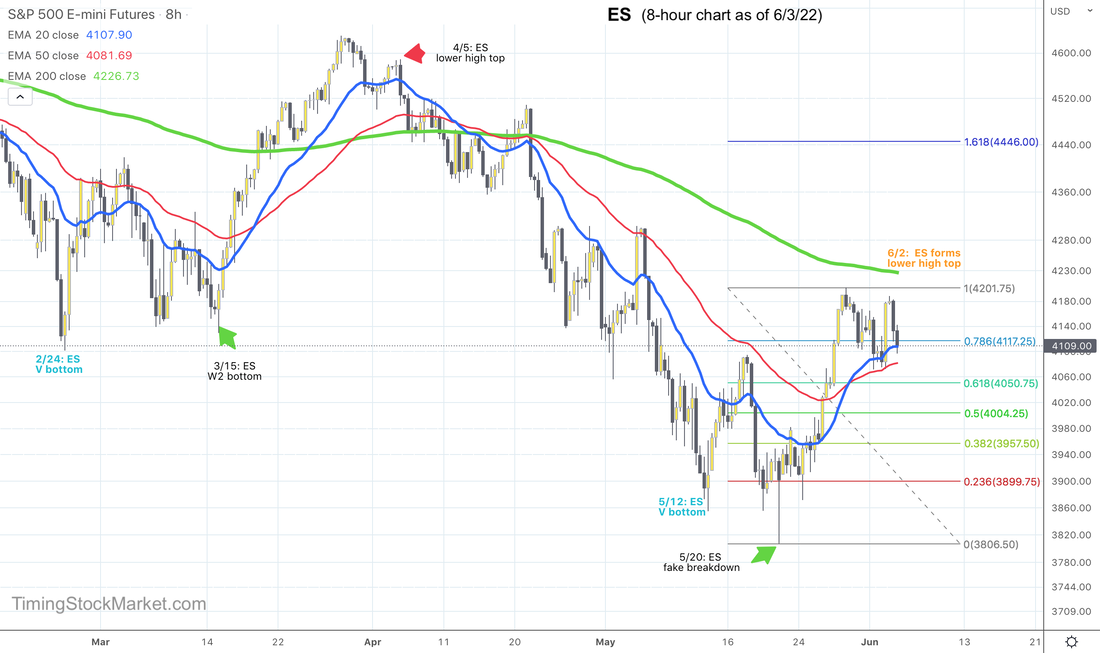
Trade plan Click here for live trades. Subscribe to get our latest analysis, daily trade plans and live intraday trades. Current trade record here. Disclaimer The information presented here is our own personal opinion. Consider it as food for thought. We are not offering financial advice. We are not promoting any financial products. We are not registered financial advisers or licensed brokers. We make no guarantee that anything will unfold according to our projections. You are proceeding at your own risk if you follow our trades. |
Archives
July 2024
Categories |
 RSS Feed
|
|
Copyright (c) 2019-2024 LOOK Systems LLC
All rights reserved. |