|
Market context $SPX $NDX SPY QQQ TQQQ charged out of the gate at open, gapped up and continued marching up during the morning. This was expected as we described in our weekend analysis. Prices were going to test Resistance1 again. And they were in a hurry to do so, after dawdling about at the end of last week. Prices passed the test at Resistance1, so Surge9 is intact for now. The question on the minds of most traders is “should we be shorting yet?” We will discuss that below. Trade review In the trading plan for Friday 11/22, we proposed this trade to consider for short and intermediate term: If you are waiting to enter long $SPX $NDX SPY QQQ TQQQ:
Prices tested Support1 one last time on Friday. The above trade got filled. This is what the model portfolio looks like. 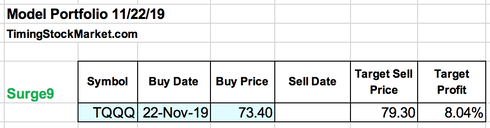 The rest of this article covers: Table of support and resistance levels Market directions: short, intermediate and long term Planning your trades To read the full article, register your email here. You will get immediate full access to all our nightly analysis and trading plans. No credit card necessary. Trial membership is FREE for one month. Here are testimonials from our readers.
0 Comments
Market context
$SPX $NDX SPY QQQ TQQQ spent most of Friday testing Support1 again, and Support1 held again. Between 11/20 and 11/23, prices have reached down to Support1 three times, during the trading day and during overnight sessions. Each time, Support1 held successfully. This implies that there are sufficient buyers in this zone to keep prices aloft for a while longer. The rest of this article covers: Trade review Table of support and resistance levels Market directions: short, intermediate and long term Planning your trades To read the full article, register your email here. You will get immediate full access to all our nightly analysis and trading plans. No credit card necessary. Trial membership is FREE for one month. Here are testimonials from our readers. Review of trades
In the trading plan for Thursday 11/22, we proposed this trade to consider. Short-term trade - Long: $SPX $NDX SPY QQQ TQQQ are likely to test Support1 tomorrow and bounce up toward Resistance1, in their attempt to rise to the same high or higher high.
The rest of this article covers: Table of support and resistance levels Market directions: short, intermediate and long term Planning your trades To read the full article, register your email here. You will get immediate full access to all our nightly analysis and trading plans. No credit card necessary. Trial membership is FREE for one month. Here are testimonials from our readers. Market context
This morning we posted an updated S/R table for $SPX $NDX SPY QQQ TQQQ, in anticipation of a drop down to at least Support2. This zone got hit with fairly amazing accuracy. So now what? Let's take a look at the support and resistance levels in the new landscape. The rest of this article covers: Table of support and resistance levels Market directions: short, intermediate and long term Planning your trades To read the full article, register your email here. You will get immediate full access to all our nightly analysis and trading plans. No credit card necessary. Trial membership is FREE for one month. Here are testimonials from our readers. To continue getting access to real time updates like this, click here to register and enjoy one whole month of FREE trial membership. 8:59 AM EST Overnight actions looked bearish for $SPX $NDX SPY QQQ TQQQ. It looks like prices are starting to wake up to the fact that market internals have been weakening for multiple sessions now. For today, we think prices can drop more than our projections last night. We have updated the S/R table based on overnight's actions in futures. 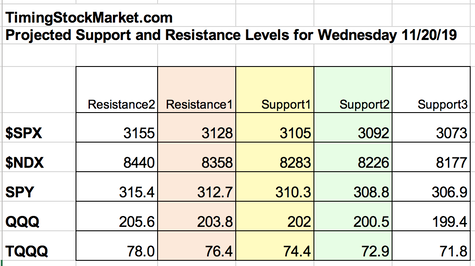 We think that $SPX $NDX SPY QQQ TQQQ can drop all the way down to the new Support3 before reversing upward. This drop may start today, but may not reach Support3 until Thursday or Friday. Short-term trade: If you want to enter long $SPX $NDX SPY QQQ TQQQ:
Short-term trade: You can short this market using SQQQ or SDS.
Market context
For short and intermediate-term trades, we recommended in our post for today Monday to enter long $SPX $NDX SPY QQQ TQQQ at Support1 with part of your trading capital. Early this morning Monday, $NDX QQQ TQQQ pretty much reached Support1 level from yesterday's S/R table, before doing a sharp upward reversal. However, $SPX SPY didn't even come close. The bullish momentum was very strong today. The rest of this article covers: Table of support and resistance levels Market directions: short, intermediate and long term Planning your trades To read the full article, register your email here. You will get immediate full access to all our nightly analysis and trading plans. No credit card necessary. Trial membership is FREE for one month. Here are testimonials from our readers. Up, up and away
That is what the stock market is doing right now. There are a number of reasons to explain this bullishness. Some of them may even be true:
Clearly no one really knows why. Clearly market participants don’t care. Clearly they are buying. So we have 3 choices:
The ultimate choice is up to you. We want to provide you with sufficient data to base your decisions on. The rest of this article covers: Table of support and resistance levels Market directions: short, intermediate and long term Planning your trades To read the full article, register your email here. You will get immediate full access to all our nightly analysis and trading plans. No credit card necessary. Trial membership is FREE for one month. Here are testimonials from our readers. This article covers:
Table of support and resistance levels Market directions: short, intermediate and long term Planning your trades To read the full article, register your email here. You will get immediate full access to all our nightly analysis and trading plans. No credit card necessary. Trial membership is FREE for one month. Here are testimonials from our readers. Projections from market internals
All market internal indicators are sending out the same bearish message, especially market breadth. It has been dropping steadily for 7 sessions in a row, and is now in short-term bearish territory. IWM has been down since Nov 5. EEM has been down since Nov 7. JNK has been down since Oct 25. (These ETFs usually lead the price actions for $SPX $NDX SPY QQQ TQQQ.) So clearly, under the hood, there is a short-term bearish bias. Nevertheless $SPX $NDX SPY QQQ TQQQ are still sitting at the top, and can still drift higher. Or they may go sideway for a while, and then surge up. While they continue to do this, and until market internals reverse from their bearish messages, we have a bearish divergence, which is not good for stocks as time progresses. The rest of this article covers: Projections from market internals (more) Table of support and resistance levels Planning your trades To read the full article, register your email here. You will get immediate full access to all our nightly analysis and trading plans. No credit card necessary. Trial membership is FREE for one month. Here are testimonials from our readers. Market context
All stock indices rose up sharply at the start of today as the headlines blared: “The bulls are back, global recession concerns vanish and ‘Fear of Missing Out’ prompts a wave of optimism and jump in exposure to equities and cyclicals" (source: Bank of America) Prices rose just enough above Resistance1 for $SPX $NDX SPY QQQ TQQQ to trigger protective stops for bearish positions, and buy stops for bullish positions. Then came the afternoon sharp reversal downward. Enough to cause pain for the late bulls, and regrets for the stopped-out bears. If you have been following our short-term trade setups, you may have entered long at Support1 in the last couple days, and taken profit at Resistance1 today. You would have made small amounts of profits. If you have been waiting for the pullback to enter long for the intermediate terms, you probably groaned in disappointment at the start of the day, but felt glad you didn’t jump in once prices reversed in the afternoon. Meanwhile, market internals continue to deliver a firm short-term bearish message under the hood. However, prices can still drift higher, widening the bearish divergence. This makes our trading decisions much harder. The rest of this article covers: Table of support and resistance levels Projections from market internals Planning your trades To read the rest of the article, register your email here. You will get immediate full access to all our nightly analysis and trading plans. No credit card necessary. Trial membership is FREE for one month. Here are testimonials from our readers. |
Archives
July 2024
Categories |
 RSS Feed
|
|
Copyright (c) 2019-2024 LOOK Systems LLC
All rights reserved. |