|
Market Context
FOMC announcement was a non-event today. From WSJ: “The Federal Reserve held its benchmark interest rate steady and signaled no appetite to raise it anytime soon…. Fed officials indicated comfort with leaving policy on hold through next year, while keeping an eye on economic data.” Market participants decided to celebrate by buying. $SPX $NDX $RUT all rose a bit after not doing much earlier in the day. The mood has turned from uncertain and cautious to bullish. Does this mean that Surge10 is starting? We will drill down into that question below. The full article covers: Support & Resistance Levels Market Internal Indicators Market Projections Model Portfolio To read the full article, register your email here. You will get immediate full access to all our nightly analysis and trading plans. No credit card necessary. Trial membership is FREE for one month. Here are testimonials from our readers.
0 Comments
Get the full trading plan and how to prepare for FOMC tomorrow Wednesday 12/11.
The full article covers: Support & Resistance Levels Market Internal Indicators Market Directions: Short, Intermediate and Long Term Model Portfolio To read the full article, register your email here. You will get immediate full access to all our nightly analysis and trading plans. No credit card necessary. Trial membership is FREE for one month. Here are testimonials from our readers. Excerpts from trading plan for Monday:
Market Context Here are some events to prepare for this week.
From WSJ: "The S&P 500 is having its best run in six years, but individual investors are fleeing stock funds at the fastest pace in decades. Investors have pulled $135.5 billion from U.S. stock-focused mutual funds and exchange-traded funds so far this year, the biggest withdrawals on record, according to data provider Refinitiv Lipper, which tracked the data going back to 1992.” “Investors and policy makers are bracing for new disruptions to short-term cash markets going into the end of the year. Federal Reserve officials have so far committed about $350 billion to efforts aimed at calming the market for repos.” What might we conclude from all this info? There are still a lot of potential buyers out there to keep the bullish momentum going in the stock market. But keep an eye on liquidity issues in arcane debt markets. When liquidity suddenly dries up in these debt markets is when the current stock Up Trend may end. Support & Resistance Levels That's the big picture context. For short term trades, let's take a look at the S/R levels for tomorrow Monday. ... The full article covers: Support & Resistance Levels (charts) Market Internal Indicators Market Directions: Short, Intermediate and Long Term Model Portfolio To read the full article, register your email here. You will get immediate full access to all our nightly analysis and trading plans. No credit card necessary. Trial membership is FREE for one month. Here are testimonials from our readers. Excerpts from trading plan for Friday:
Projection between now and FOMC on 12/11: There are many possibilities that can happen in the market between now and FOMC announcement on 12/11. However, there are 2 specific scenarios worth considering. One is highly bullish, and the other is quite bearish. ... The full article covers: Support & Resistance Levels (charts) Market Internal Indicators Market Directions: Short, Intermediate and Long Term Model Portfolio To read the full article, register your email here. You will get immediate full access to all our nightly analysis and trading plans. No credit card necessary. Trial membership is FREE for one month. Here are testimonials from our readers. Q&A
Different readers have asked how we arrive at the S/R levels. The answer is they are based on observing where price actions encountered significant events before. This includes previous highs, previous lows, and areas where price spent a lot of time consolidating. Our S/R levels are not based on the typical Fib levels, or trend line projections. Some readers have also asked about the meaning of “contango”. This concept comes into play when trading derivatives of $VIX such as TVIX, UVXY, SVXY. We wrote a lengthy article about it here. Table of support & resistance levels We have updated the S/R table to reflect the latest price actions. ... The rest of this article covers: Table of Support & Resistance Levels (more) Market Internal Indicators Market Directions: Short, Intermediate and Long Term Trading with Model Portfolio To read the full article, register your email here. You will get immediate full access to all our nightly analysis and trading plans. No credit card necessary. Trial membership is FREE for one month. Here are testimonials from our readers. Market context
This headline from WSJ "Trump Says Trade War Could Drag On, Stokes France Spat" and others are the reasons for the sharp drop this morning. We went through this back in May and August. Most of us now know that both threats and promises like these are empty. But they do jerk the markets around because there are lots of algos out there trading on headlines. And algos haven’t been taught the art of taking everything with a grain of salt yet. Starting in late November, we had been writing about how market internals were sending out messages suggesting that the rise of stocks were weakening under the hood. All stocks needed was a catalyst to start the selling. All the trade war threats since Monday 12/2 have functioned as major catalysts. As a matter of fact, they function so well, they swung $VIX and $VXN from mega complacency into a state of real fear. We projected in our weekend analysis that $VIX would reach 16 and $VXN would reach 19 when Pullback4 is done. Today $VIX surged up to 18 at its intraday high, and $VXN surged up to over 21. So does this mean Pullback4 is done yet? Or will it turn into Major Pullback4? We have some scenarios and probabilities for you to consider in your trading preparation for tomorrow. Table of support & resistance levels We have updated the S/R table to reflect the latest price actions. ... The rest of this article covers: Table of Support & Resistance Levels (more) Market Internal Indicators Market Directions: Short, Intermediate and Long Term Trading with Model Portfolio To read the full article, register your email here. You will get immediate full access to all our nightly analysis and trading plans. No credit card necessary. Trial membership is FREE for one month. Here are testimonials from our readers. Market Context In our trading plan prepared for Friday 11/29, we wrote: In order to bring in more buyers, prices may start dropping Friday and/or Monday, down to at least Support1. And indeed this is what happened on Friday. $SPX $NDX SPY QQQ TQQQ dropped down and pretty much hit our projected Support1 levels as shown. 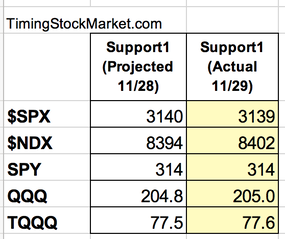 The questions now on the minds of most traders are: Is this the end of Surge9? Should we exit longs and enter shorts? We will drill down into those answers below and provide you with trading plans for short, intermediate and long term. Table of Support & Resistance Levels We have updated the S/R table to reflect the latest price actions. These are short-term support and resistance levels that most likely will come into play in the next few days... The rest of this article covers: Table of Support & Resistance Levels (more) Market Internal Indicators Market Directions: Short, Intermediate and Long Term Trading with Model Portfolio To read the full article, register your email here. You will get immediate full access to all our nightly analysis and trading plans. No credit card necessary. Trial membership is FREE for one month. Here are testimonials from our readers. |
Archives
February 2024
Categories |
 RSS Feed
|
|
Copyright (c) 2019-2024 LOOK Systems LLC
All rights reserved. |