|
Winter is coming Before we dive into the weekly analysis, let’s review some pivot points.
When Surge7 was cut short on 9/24, it was a big psychological change in the market. Market participants (us included) were holding out for at least one last bullish surge to a new all-time high for $SPX. But a noxious combination of negative news lead to additional sell-offs. And the fate of the Up Trend is highly questionable at this point. So what is a Volatile Sideway Market? Below is a visual example of a Volatile Sideway Market that occurred in 2015, lasting 5.5 months before a major crash. This is $SPX hourly chart from March until mid-August 2015. 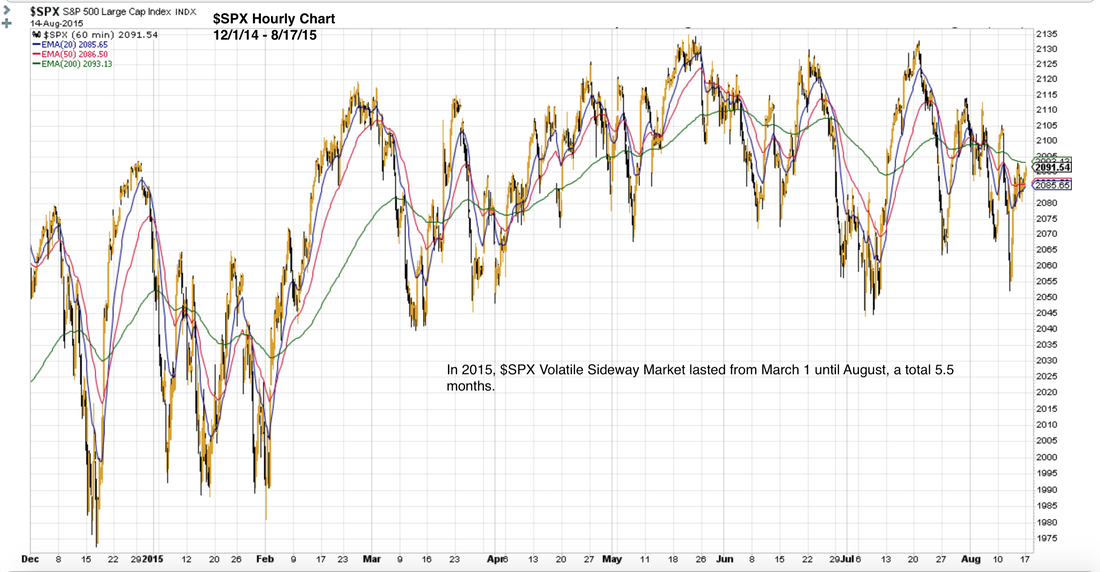 This is a rather extreme example. More typical is this type of pattern seen below. This is $SPX hourly chart from mid 2015 through the first quarter of 2016. Observe that between November and December 2015, $SPX went into a sideway market, which eventually rolled over into a steep drop that is the Down Trend at the start of 2016. This Down Trend lasted 6 weeks. 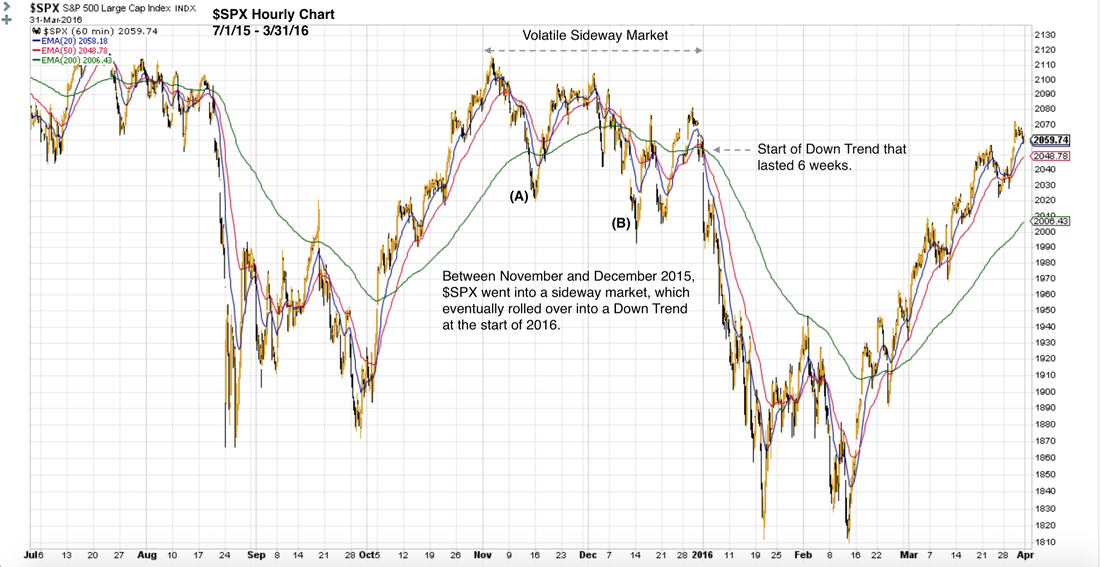 If the left side of the above chart looks familiar, it is because it greatly resembles the Major Pullback2 period of this past August. We are now at an inflection point similar to either (A) or (B). Stock market sometimes transition from an Up Trend to a Down Trend via a Volatile Sideway Market. This type of market simply reflects the fact that bulls and bears are fighting it out. The winner of this psychological battle will lead the market in the next period. As mentioned above, stocks are now at an inflection point similar to either (A) or (B). From here, there is a high probability that $SPX $NDX SPY QQQ TQQQ will swing upward one more time to test a couple resistance levels, just like how it played out in the above chart. There is also a high probability that $SPX $NDX SPY QQQ TQQQ won’t be able to break above the strong resistance formed on 9/24. How many more times will they traverse the range up and down? No one can say for sure. But there is a high probability that they will roll over into a Down Trend from the current Volatile Sideway Market some time in October. Winter is coming. The rest of this article covers: Table of support and resistance levels Updates from market internals Planning your trades Register your email here for full access to all our nightly analysis, trading plans and intraday updates. No credit card. All free.
0 Comments
Leave a Reply. |
Archives
July 2024
Categories |
 RSS Feed
|
|
Copyright (c) 2019-2024 LOOK Systems LLC
All rights reserved. |