|
Market context Our short-term message to you yesterday was that $SPX $NDX SPY QQQ TQQQ were going to drop down to key support zones first, before they can find enough buyers for the start of a Bounce. And indeed they dropped. And today's drop is unlikely to be fully done yet. More about that below. Our long-term message to you was this. Beware of this Volatile Market turning into a major Down Trend. We showed you this chart a couple of weeks ago. This is $SPX hourly chart in late December 2015. Note the candle pattern that formed at the arrow prior to the crash. 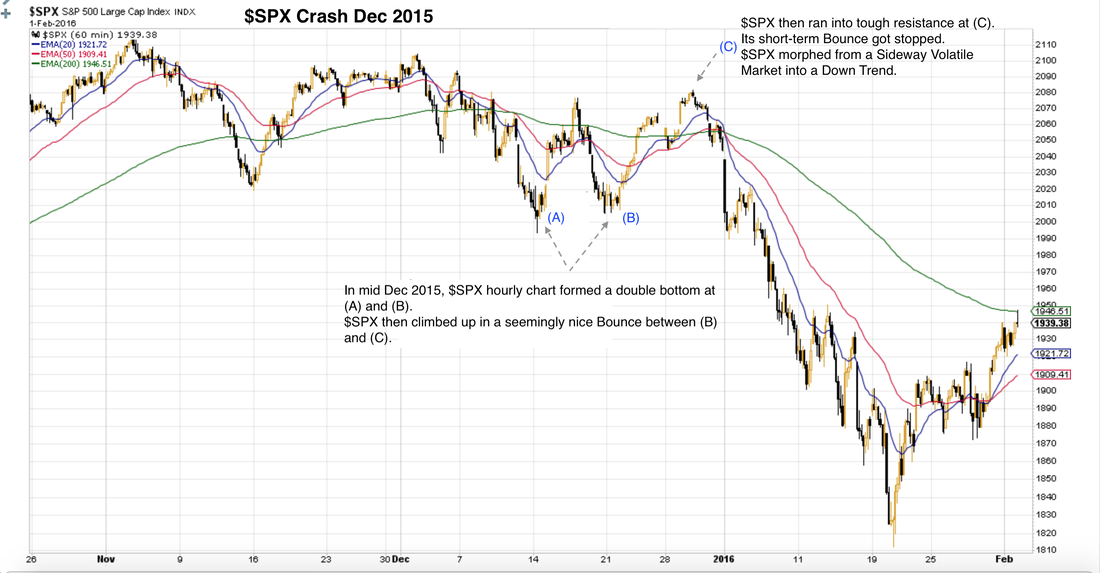 Below is the current $SPX hourly chart. Observe how the candle patterns are quite similar to what $SPX looks like in the above chart from 2015. 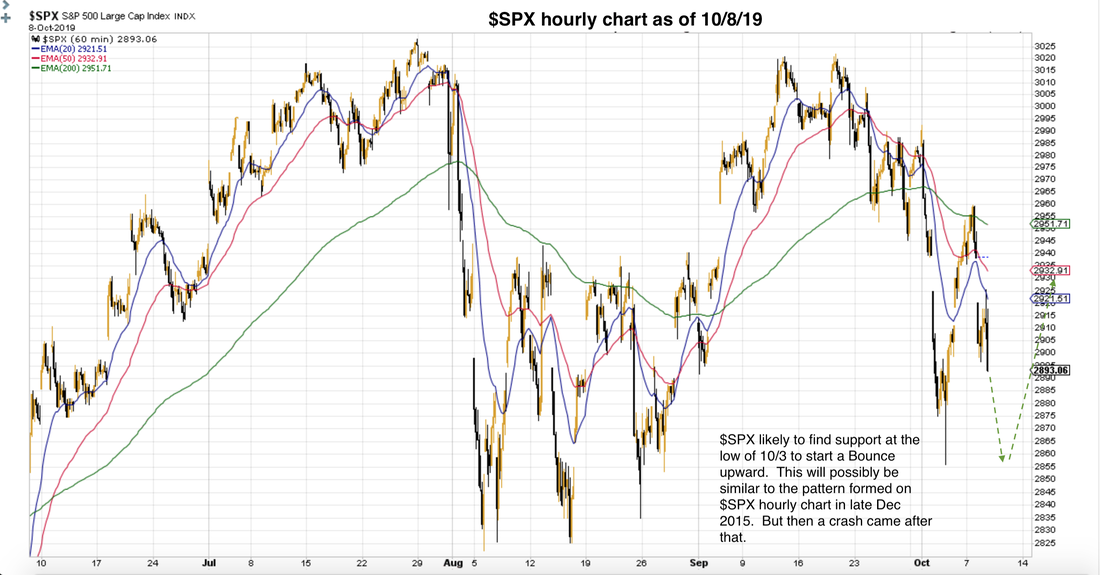 We are likely to see a short-term Bounce. But what happens after that may not be so great for traders with a bullish bias, as well as the majority of long-term investors. The rest of this article covers: Table of support and resistance levels Updates from market internals Planning your trades Register your email here for full access to all our nightly analysis, trading plans and intraday updates. No credit card. All free.
0 Comments
Leave a Reply. |
Archives
July 2024
Categories |
 RSS Feed
|
|
Copyright (c) 2019-2024 LOOK Systems LLC
All rights reserved. |