|
Down Trend Still Intact The Down Trend that started on February 19 is still intact. The blowout move by $VIX $VXN on Friday 3/6 is still just an interim move. So far we have:
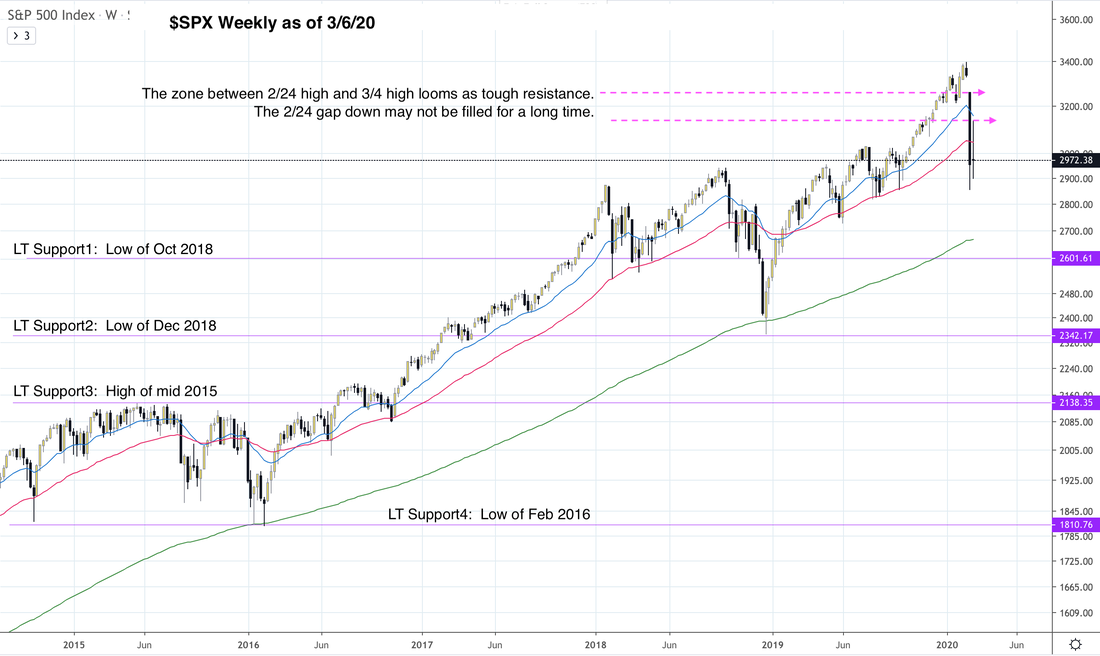
There are likely a few more moves at the minimum: Bounce2, Drop3, Bounce3. That’s the optimistic bullish scenario, a short-lived Down Trend that will eventually retest the lows October 2018 and then be done. In the super bearish scenario, this Down Trend can go down lower, as shown in $SPX weekly chart below. If we end up with a financial crisis similar to 2008, $SPX can drop down as low as the low of February 2016. That means $SPX can give up potentially 4 years worth of gain in a few months of sharp drops, similar to 2008-2009. Reality is probably somewhere in between. Right now, it is simply too early to project, but here are some projections by analysts that may be of interest to you.
Note that $SPX at 2450 is the zone where the last Down Trend of ended in Dec 2018. Subscribe to read the full article, and get access to our daily trading plans immediately. The full article covers: Short-term Support & Resistance Levels
Market Internal Indicators
Market internal indicators give us a daily glimpse into the short-term direction of the market. Trading Plan
Subscribe now and take advantage of our introductory low rate of only $39 per month.
0 Comments
Leave a Reply. |
Archives
July 2024
Categories |

 RSS Feed