|
The Big Picture and The Long Term Portfolio We received a lot of questions this week from our members. There was a common theme in the question: Is this Down Trend done yet? Are we about to start an Up Trend given the price actions at the end of the week? The answers are:
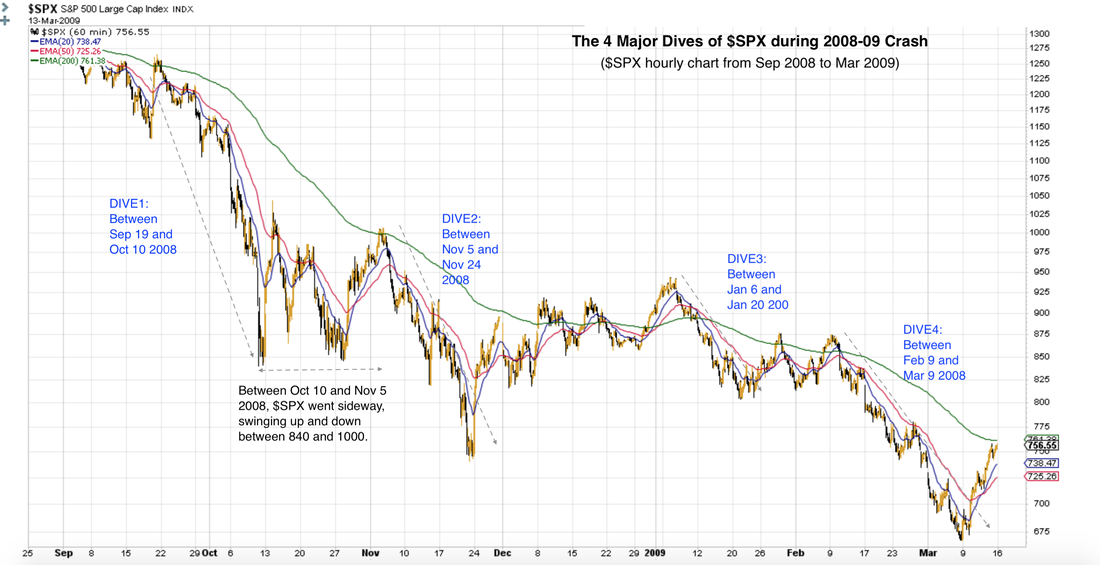
So where are we in this Down Trend? To reliably answer that, we turn to $VIX $VXN charts. In our experience, $VIX $VXN tend to follow certain recurring patterns during Down Trend or Major Pullbacks. And $SPX $NDX $RUT tend to follow these patterns too, but analyzing them is harder. So we go back and use $VIX $VXN patterns from the crash of 2008 to help guide us through this current crash. Last week, we introduced a new term “Dive”. “Dive” refers to the big down segments that constitute the core of the trend. A major Dive in a Down Trend is equivalent to a major Surge in an Up Trend. This Down Trend most likely will have 4 to 5 Dives. $SPX $NDX $RUT are likely finishing up Dive1 right now. Below is $SPX hourly chart from the crash of 2008. It shows 4 major Dives spanning a period of 6 months that comprised the entire Down Trend. (We use the hourly chart because the show the Dives better.) The current Down Trend that started on Feb 20 is likely to experience 4 major Dives also, and may span anywhere from 6 to 8 months. Here is a projection of how the 4 Dives can unfold, and how low $SPX is likely to go during this Down Trend. Subscribe to read the rest of this article, and all the latest intraday updates for $SPX $NDX $RUT SPY QQQ TQQQ. Take advantage of our introductory low rate of just $39/month. You can cancel at any time.
0 Comments
Leave a Reply. |
Archives
July 2024
Categories |

 RSS Feed