|
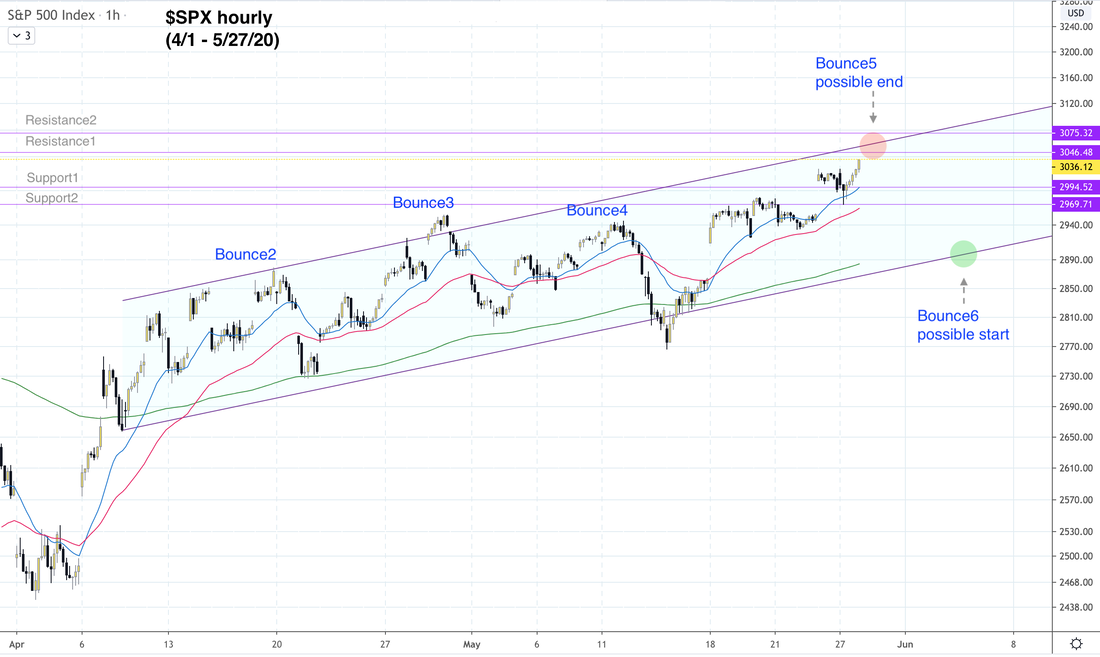
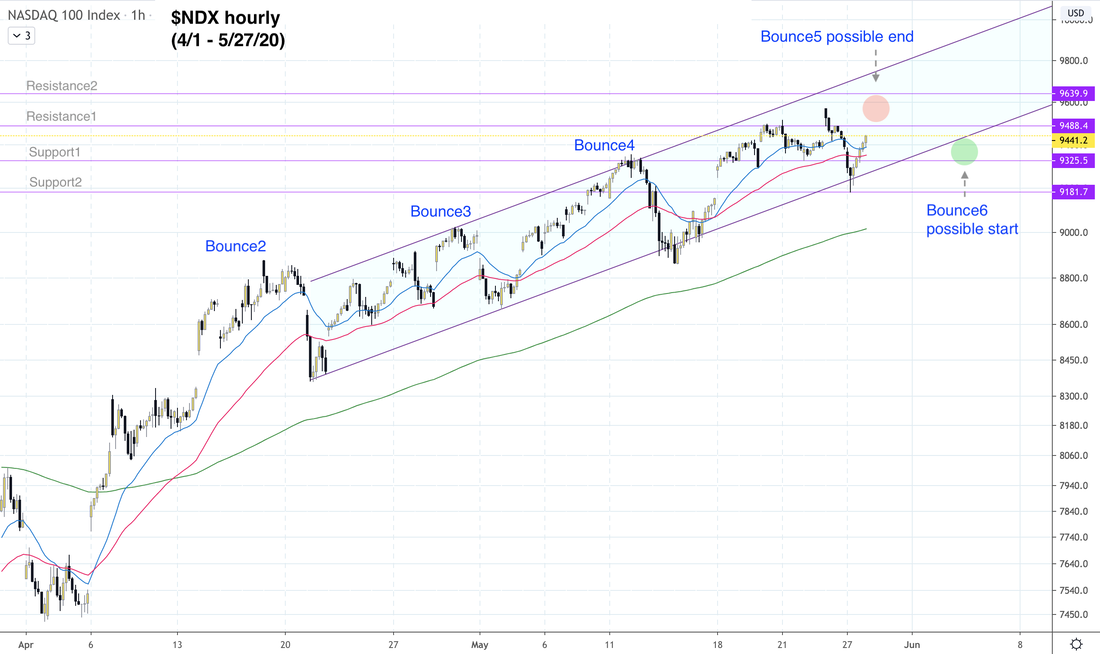
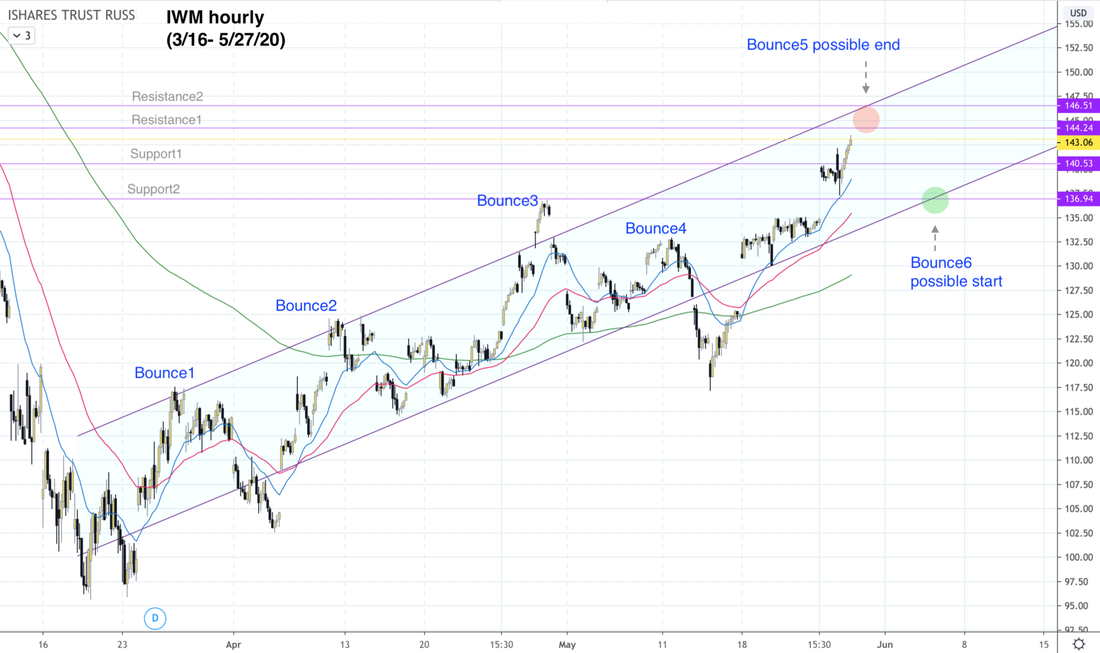
See FAQ for more explanations on terms, labels and abbreviations that we use. We called this bearish reversal with our post pre-market at 1:46 AM on Thursday 5/28/20. We shared the following hourly charts of $SPX $NDX IWM with red circles drawn to show the areas where Bounce5 was likely to end. During trading hours on Thursday, $SPX $NDX IWM reached the red circles and promptly reversed downward as we projected. This marked the end of Bounce5. Even though this setup did not meet our more stringent criteria for a multi-day ST trade, it was plenty of advance warnings for day traders and very ST swing traders to put on a profitable trade. For example, entering into TZA at open when IWM gapped up into the red circle on the chart, and selling during the first hour of Friday would have resulted in a 16.5% gain. We provide nightly analysis along with signal updates for all time frames for $SPX $NDX SPY QQQ IWM TNA TZA. Members also get access to our timely intraday updates and in-depth weekend analysis. SUBSCRIBE now and take advantage of our introductory low rate of just $39/month. You can cancel at any time.
0 Comments
Leave a Reply. |
Archives
July 2024
Categories |


 RSS Feed