|
Click here for our Signal Trades. Below is a time-delayed excerpt from our live updates for members. Updates 12:30 AM EST - Wednesday 9/23/20 $VXN
This means that the bearish headwinds for $NDX eased up a bit today. This enabled $NDX to rise some amount. However, as shown in its hourly chart below, $VXN is likely to anchor at the red rectangle near its 200-hour EMA. If $VXN does, this is an anchor-to-rise pattern. When $VXN resumes its rise, it means the bearish headwinds are accelerating, and $NDX will likely drop sharply. 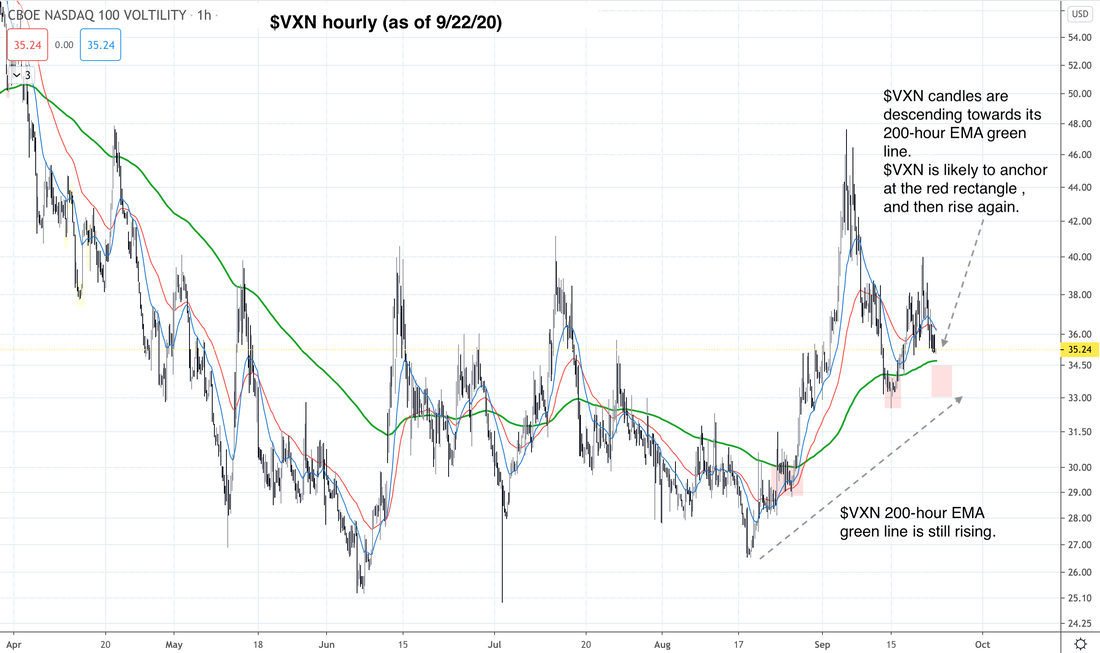 $VIX $VIX is forming the same pattern of ascension that it formed back in Feb, as shown on its daily chart below. Despite spending the last 7 sessions futzing around, $VIX has shown that it is clearly anchored in its red zone. If it continues staying at this level, $VIX is capable of breaking out. Again, this would be very strong bearish headwinds for $SPX IWM. 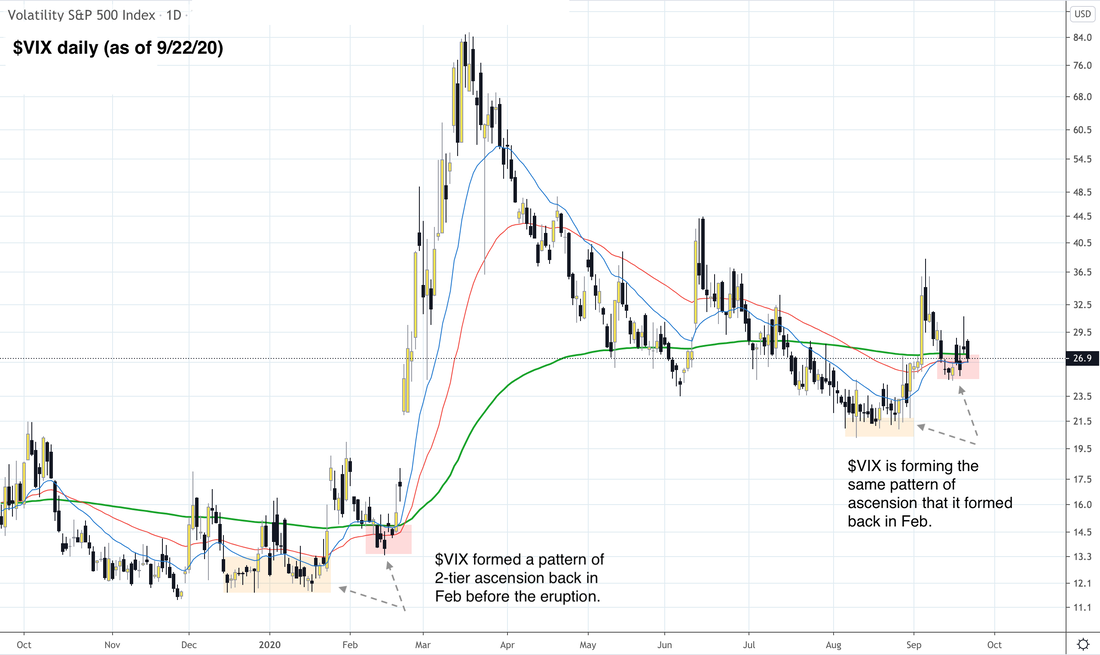 Table of Support & Resistance Zones We've updated the orange resistance zones and the green support zones to reflect the short swings within the down channels. Click here for our Signal Trades. SUBSCRIBE now to read the rest of this post, including full analysis and projections for $SPX $NDX IWM. Get complete access to our intraday live Signal Trades. Take advantage of our introductory low rate of just $39/month. You can cancel anytime.
0 Comments
Leave a Reply. |
Archives
July 2024
Categories |
 RSS Feed
|
|
Copyright (c) 2019-2024 LOOK Systems LLC
All rights reserved. |