|
Click here for our Signal Trades. Below is a time-delayed excerpt from our live updates for members. Updates 5:32 PM EST - Tuesday 10/27/20 After hour entries The bearish signals we discussed just before closing turned really bearish after hours. Futures are dropping sharply, $VIX swung up sharply at end of day, and $VXN anchored at support by closing. UVXY and TZA have gapped up, and SQQQ is ready to climb more. These signals indicate that market participants are growing more nervous as the election approaches. While there most likely won't be a full-blown crash as in February, we may see more selling that will take $SPX $NDX IWM to the bottom of their green support zones, or 9/24 lows. We have decided to enter one UVXY full position (Big Swing) in Signal Trades, and have placed an updated buy order to add more UVXY on minor pullbacks. We will post new Quick Swing positions pre-market. Updates 3:43 PM EST - Tuesday 10/27/20 End of day Bearish: $SPX $NDX IWM are not finding enough buyers to lift them up higher. Any attempt to seriously rise are met with selling. IWM looks vulnerable to a drop lower than 10/26 low. In our Signal Trades, we got stopped out of the Quick Swing TNA trade. Our UVXY Big Swing buy order is still intact. Updates 2:54 AM EST - Tuesday 10/27/20 Summary Bearish: $SPX $NDX IWM may continue dropping more, as $VIX $VXN continue to rise. UVXY Many traders on Stocktwits were surprised at the persistent selling in stocks today. But you had plenty of warnings. Last Thursday (2:14 AM post), we alerted you that things were turning bearish for $SPX $NDX IWM. This was based primarily on the bearish patterns of UVXY. With today's upward surge, UVXY has finished forming a big W bottom on its hourly chart. This pattern is frequently seen before UVXY rises up substantially. 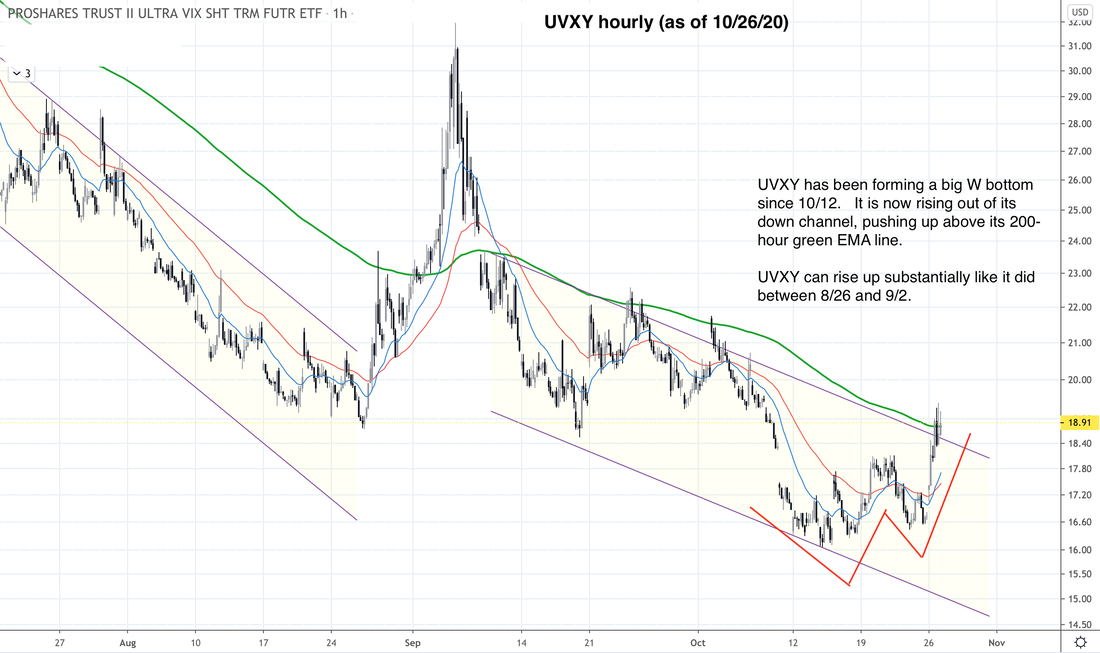 $VIX We've been writing that $VIX tight range is something to be concerned about. $VIX usually contracts tightly before it surges. Today's $VIX gapped up above its 200-day EMA green line. This suggests that the contraction is now turning into a potential multi-day surge. 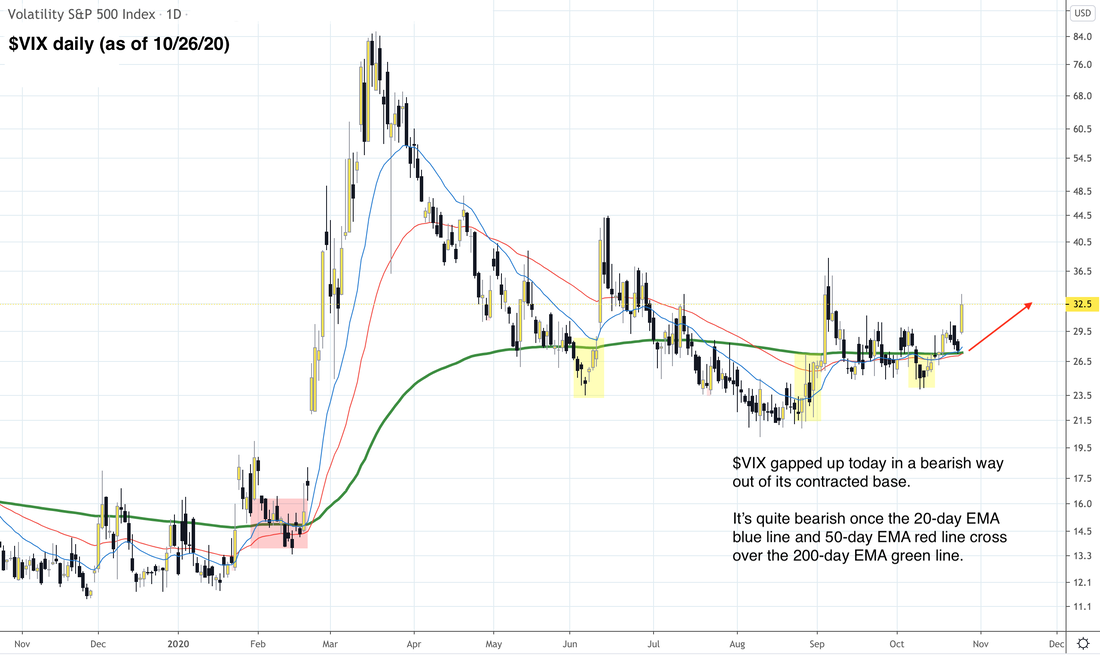 $VXN Similar to $VIX, $VXN is forming the kind of pattern that typically precedes a bigger rise. 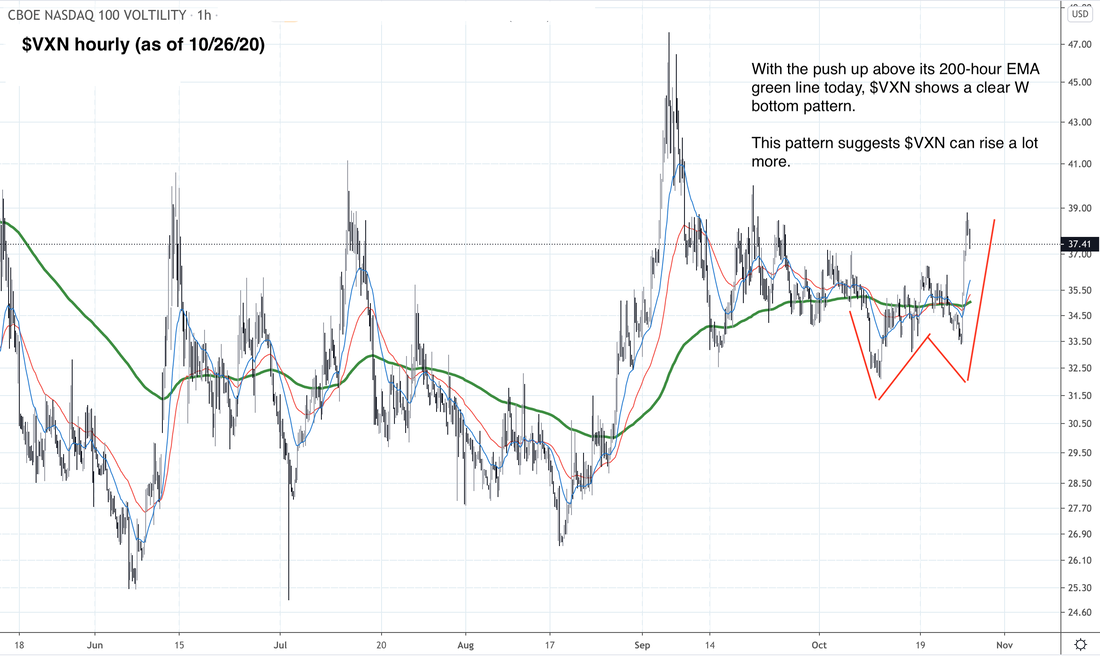 Table of Support & Resistance Zones The S/R table has been updated to reflect the downward pressure on $SPX $NDX IWM. ... SUBSCRIBE now to read the rest of this post, including current analysis and projections for $SPX $NDX IWM. Get complete access to our intraday live Signal Trades. Take advantage of our introductory low rate of just $39/month. You can cancel anytime. Click here for our Signal Trades.
0 Comments
Leave a Reply. |
Archives
July 2024
Categories |
 RSS Feed
|
|
Copyright (c) 2019-2024 LOOK Systems LLC
All rights reserved. |