|
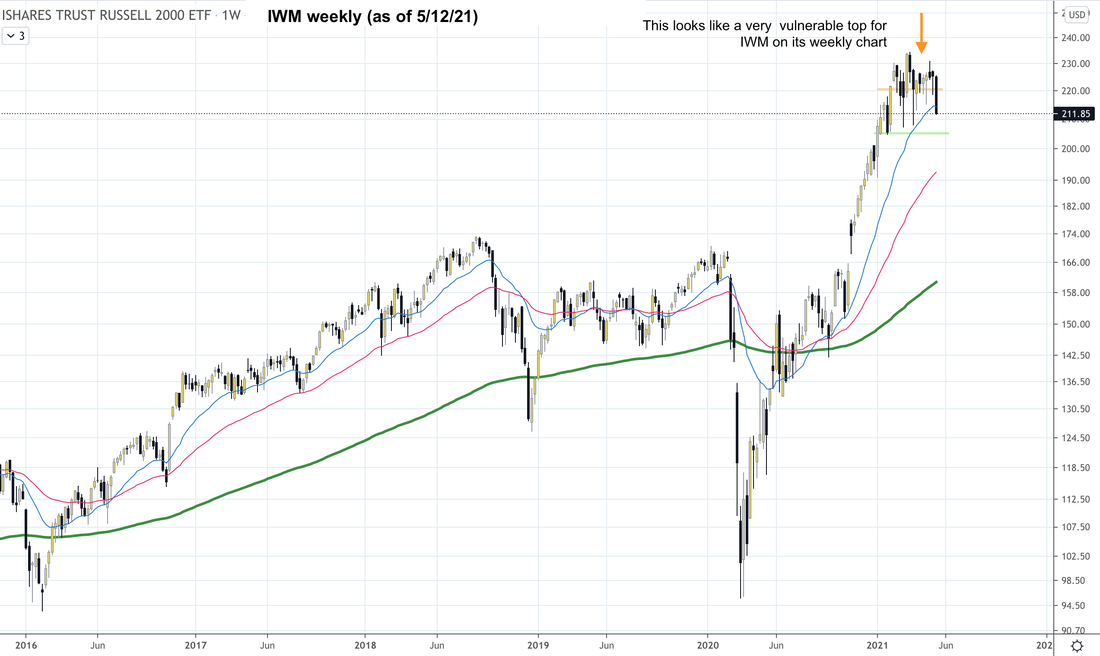
Entry/exit signals for SPY QQQ TQQQ IWM SPX NDX based on VIX. Click here for our Signal Trades. Updates 2:30 AM EST- Thursday 5/13/21 Perspective Market was not happy about the CPI report on Wednesday morning. As a result, $SPX $NDX IWM all dropped sharply, and $VIX $VXN $RVX surged up substantially. We shared with you yesterday warnings from various indicators: It appears that $NDX is continuing the process of pulling back, much more so than $SPX and IWM. There are important indicators sending out highly bearish messages about $NDX. They confirm that the sell-off may be substantial. Now we need to determine the potential scope of this major pullback. Could it be a crash? Table of Support & Resistance Zones The S/R table below has been updated. The green support zone is where this current major pullback may end. The orange resistance zone is short-term strong resistance level. Read the rest of this analysis, and get the latest entry/exit signals for SPY QQQ TQQQ IWM SPX NDX based on VIX here. IWM IWM weekly chart looks very vulnerable to a major drop. It may not happen right away, but IWM is now sitting just below its 20-week EMA blue line. Not finding enough support here may mean IWM eventually dropping down to its 50-week EMA red line near 190. Click here for our latest buy targets in Signal Trades.
0 Comments
Leave a Reply. |
Archives
July 2024
Categories |

 RSS Feed