|
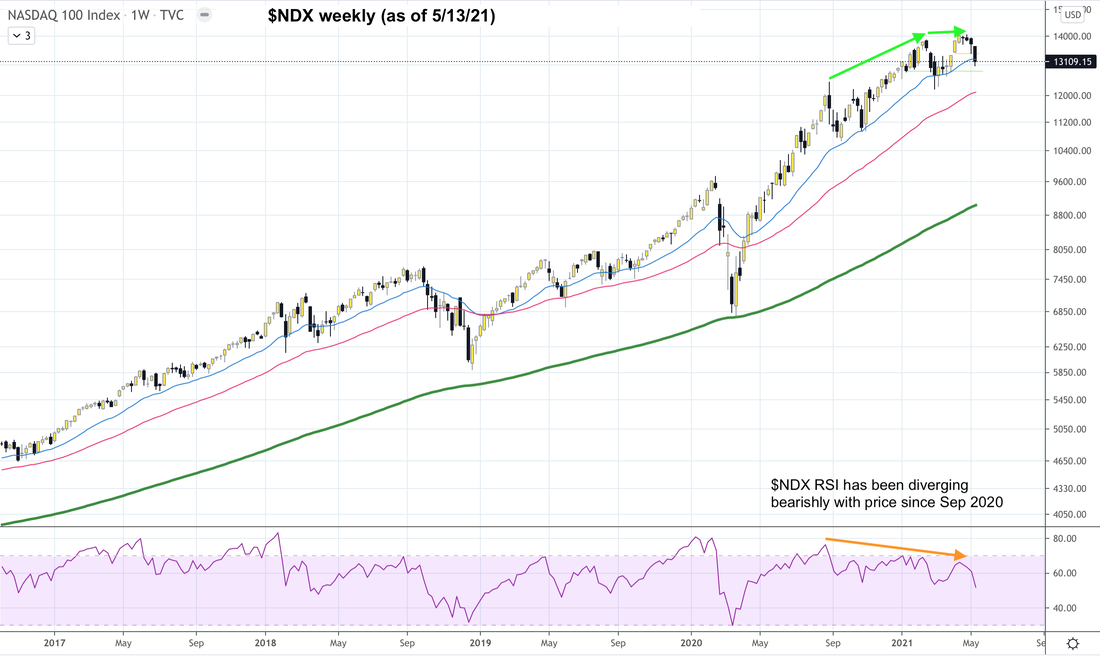
Entry/exit signals for SPY QQQ TQQQ IWM SPX NDX based on VIX. Click here for our Signal Trades. Updates 2:30 AM EST- Friday 5/14/21 Perspective Friday's economic reports are likely to move the market into another big swing. The question is which way. The answer is both. We'll explain below. Table of Support & Resistance Zones The S/R table below has been updated. The green support zone is where this current major pullback may end. The orange resistance zone is short-term strong resistance level. Read the rest of this analysis, and get the latest entry/exit signals for SPY QQQ TQQQ IWM SPX NDX based on VIX here. $NDX Weekly $NDX weekly chart shows a bearish divergence between price and RSI. This is yet another indicator that echos the bearish message from A/D and Put/Call ratio. This tells us that while we may see enthusiastic bounce from recent drops, in the big picture context, $NDX (like IWM) is quite vulnerable. Click here for our latest buy targets in Signal Trades.
0 Comments
Leave a Reply. |
Archives
July 2024
Categories |

 RSS Feed