Updates 3:14 PM ET - Friday 5/20/22 Volatility signal failure >> "Fully Bearish", but... We wrote at 9:20 this morning that key charts are showing for setups for retest of lows. We've been saying that a successful retest means volatility signal will turn "Fully Bullish". All the indices came very close to forming the pattern we've been hoping for. But the pattern failed. $SPX $NDX IWM all dropped below support from 5/17. That failure turns the signal back to "Fully Bearish". However, our SQQQ position got stopped out (at breakeven) after a strong directional move. All indices reversed sharply upward. At this point, there is a lot of conflicting data that requires further analysis. How the market closes today will offer a lot of clues. One important clue we've been tracking is that while $VIX rose up, it has not risen above the high of 5/12 yet. And $VVIX 200-hour EMA is still trending down. But we do not feel comfortable recommending either bullish or bearish entry at this point. We'll be providing a full analysis this weekend, and hopefully the end-of-day and end-of-week charts and data will reveal where market is really heading next. Updates 9:20 AM ET - Friday 5/20/22 Retest of lows likely This morning the key charts are showing setups for a retest of lows.
A successful retest of these zones may be our entry points to go long. We don't plan any Quick Bear trade here. We are getting ready for the Multi-day Bull positions only. Updates 1:30 AM ET - Friday 5/20/22 Bear market is still here, but getting close to short-term "Fully Bullish" To be clear, this bear market is still raging. But in the short term, our volatility signal may be turning "Fully Bullish" by tomorrow. What's the catalyst for stock indices to turn bullish? OpEx. Today is May options expiration for equity. This market is heavily hedged with puts. As these puts expire, dealers will buy to cover their shorts put in place previously to hedge their own books. All these short covering actions will provide fuel for a bear market rally. However, there may not be as much fuel this time as there was back in March. This is because traders are not as heavily hedged with puts. And some of these puts have already been unwound by Wednesday VixEx. So the remaining fuel for a red hot rally is low. Nevertheless, the key charts are showing very high possibility of signal turning "Fully Bullish", setting the stage for a bounce. We may only have enough fuel for this bounce to rise up to the high of 5/17. But we expect it to be a multi-day bounce. Let's take a look at the key charts containing our signals. $VIX: very close to "Fully Bullish" All of $VIX EMA lines along with $VIX itself are forming a pattern very similar to 3/15.
We expect $VIX to drop from here, at least back to 5/17 low. If it can drop lower than that, then this rally has longer to run. 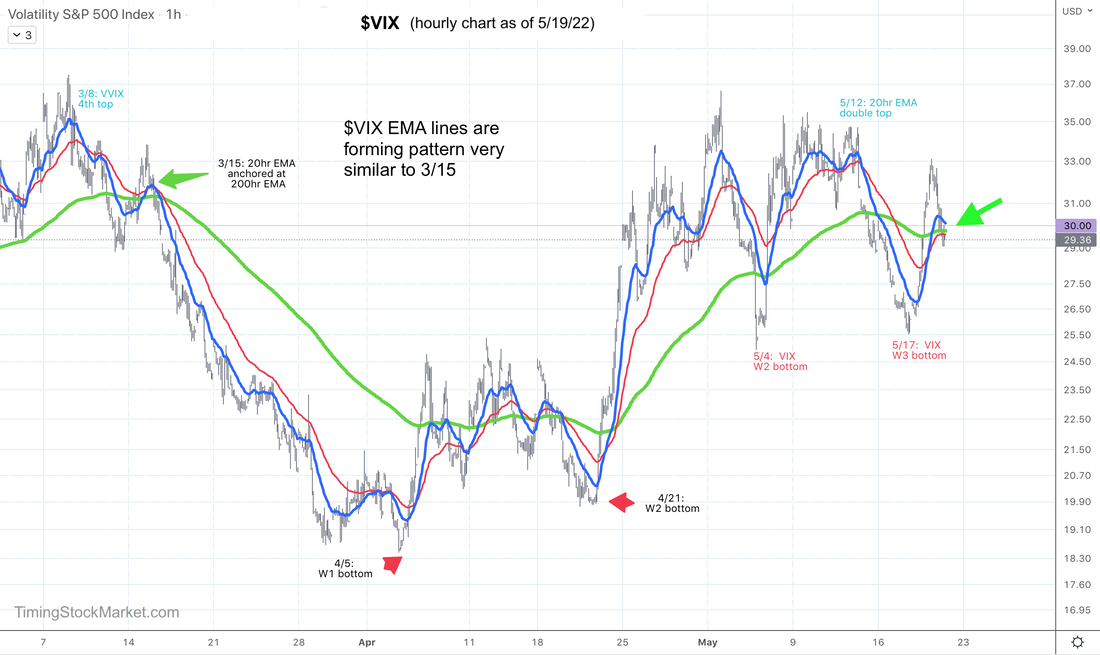 SVXY: "Fully Bullish" but... Zooming in on SVXY 15-minute chart below, we see that:
This pattern technically "Fully Bullish", but we really would like to see SVXY dipped towards 46 one more time. 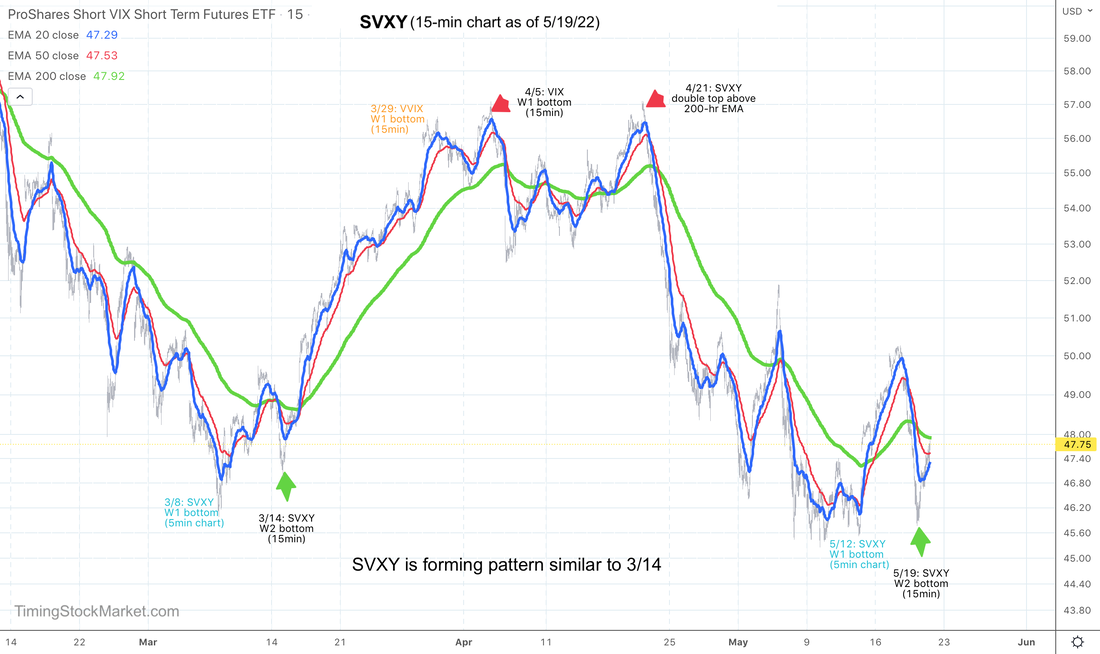 ES: very close to "Fully Bullish" ES 15-minute chart below shows it is likely to be forming a W bottom with its 20 EMA blue line. We would like to see ES consolidate a bit more below the 200 EMA green line, giving this line time to go sideway, setting the stage for a big rally. Having said this, if ES retests 3856 successfully today, we will consider it "Fully Bullish". Note also that in ES chart below, we've marked the likely resistance zones as ES climbs upward. These resistance zones apply to $SPX as well. $SPX is likely to lead the indices up, so keep an eye on these zones. 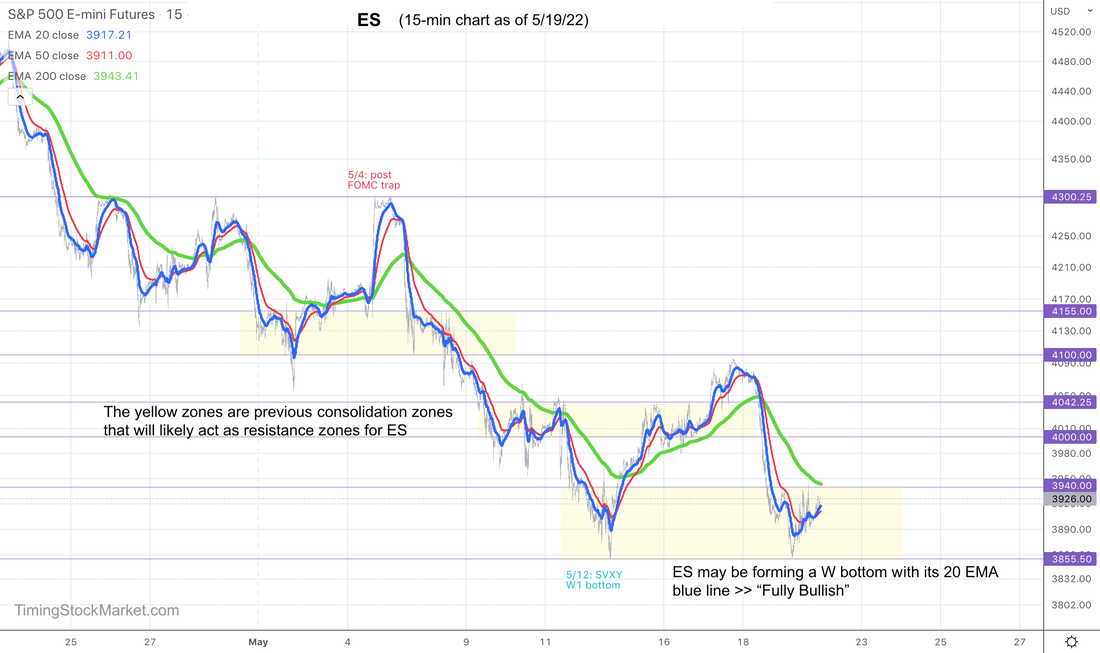 Trade plan Click here for live trades. Subscribe to get our latest analysis, daily trade plans and live intraday trades. Current trade record here. Disclaimer The information presented here is our own personal opinion. Consider it as food for thought. We are not offering financial advice. We are not promoting any financial products. We are not registered financial advisers or licensed brokers. We make no guarantee that anything will unfold according to our projections. You are proceeding at your own risk if you follow our trades.
0 Comments
Leave a Reply. |
Archives
July 2024
Categories |
 RSS Feed
|
|
Copyright (c) 2019-2024 LOOK Systems LLC
All rights reserved. |