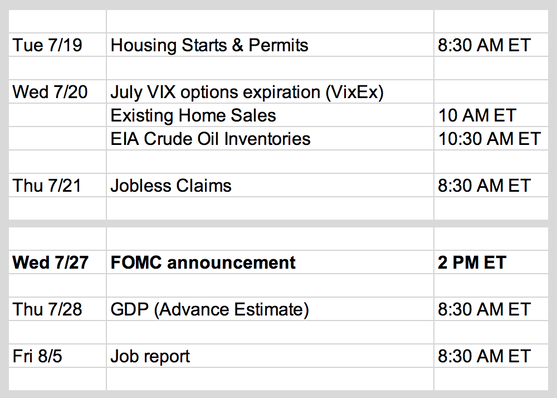
Updates 10:45 AM ET - Sunday Upcoming key events This week is lighter in economic news. Important earnings this week: The big picture: gloomy fundamentals
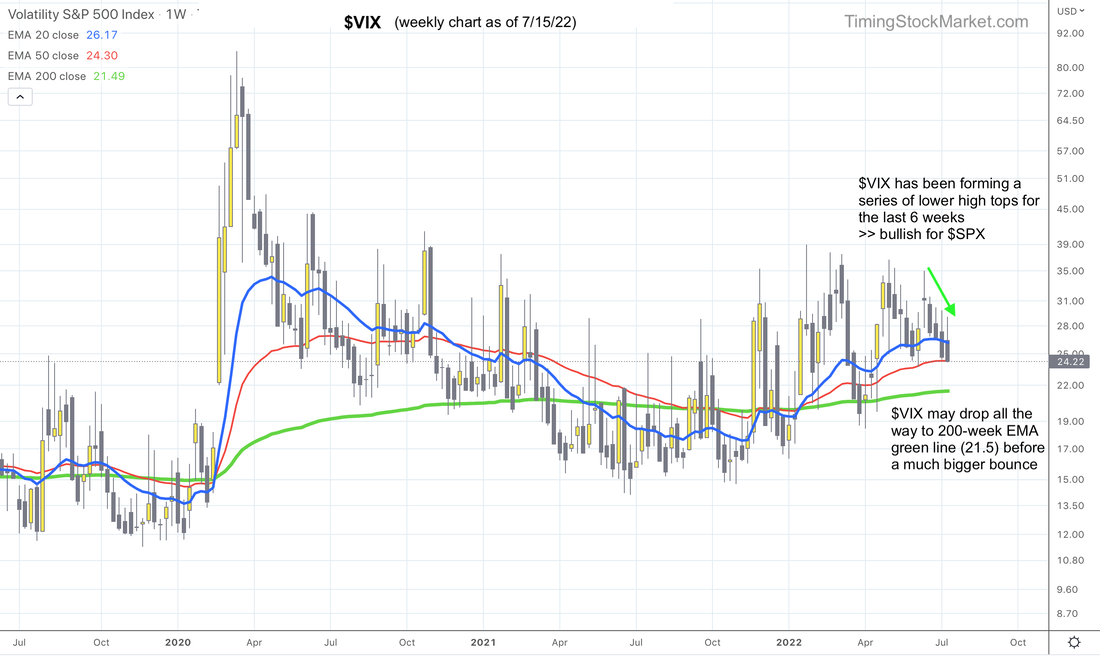
Short-term volatility signal: "Rising Bull" Yet weirdly enough, stock volatility continues to drop. $VIX weekly chart below shows it has been forming a series of lower high tops for the last 6 weeks. This has been providing bullish tailwind for $SPX. $VIX may drop all the way to its 200-week EMA green line (currently at 21.5) before a much bigger bounce. This means more short-term bullish tailwind for $SPX. Market breadth: providing bullish tailwind for stocks
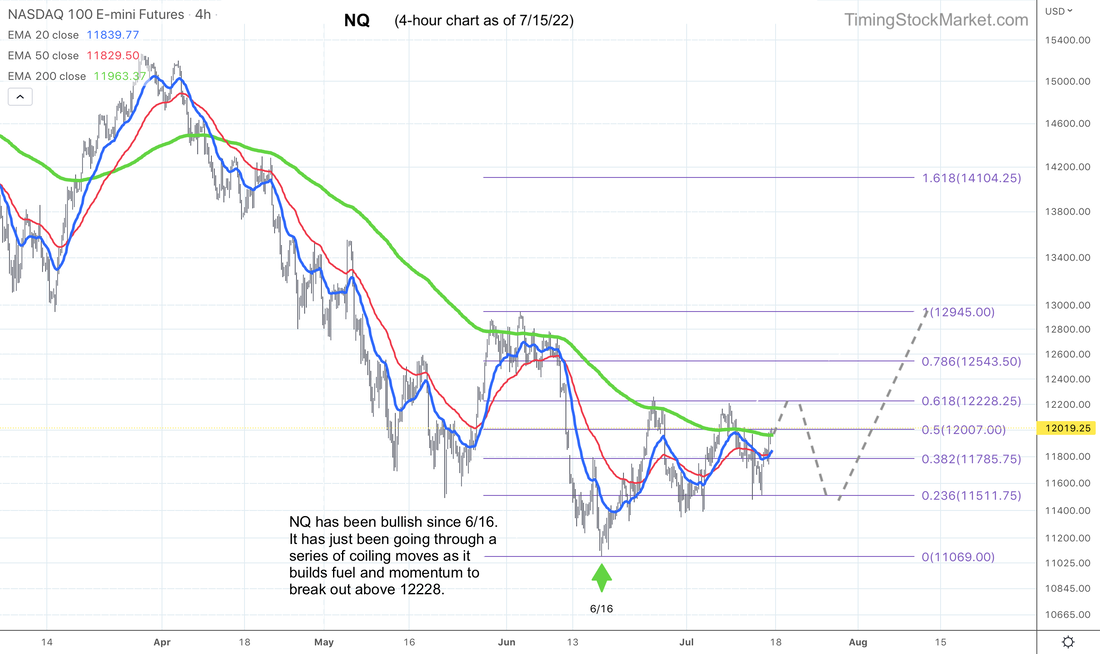
Stock indices may be coiling to break out In looking at Nasdaq futures NQ 4-hour chart below, it is now clearer that NQ has been bullish since 6/16 low. And since that low, NQ has been coiling to form a base, as evident in the patterns of its 20 EMA blue line and 50 EMA red line. There is a high probability that this coiling base will result in a breakout, most likely post FOMC next Wednesday 7/27. The breakout may push price back up to the highs of 6/2. This is true for NQ as well as ES and RTY. Trade plan Click here for live trades. Subscribe to get our latest analysis, daily trade plans and live intraday trades. Current trade record here. Disclaimer The information presented here is our own personal opinion. Consider it as food for thought. We are not offering financial advice. We are not promoting any financial products. We are not registered financial advisers or licensed brokers. We make no guarantee that anything will unfold according to our projections. You are proceeding at your own risk if you follow our trades.
0 Comments
Leave a Reply. |
Archives
July 2024
Categories |


 RSS Feed