Updates 10:30 PM ET - Sunday Upcoming key events Thursday and Friday this week are major market moving days. 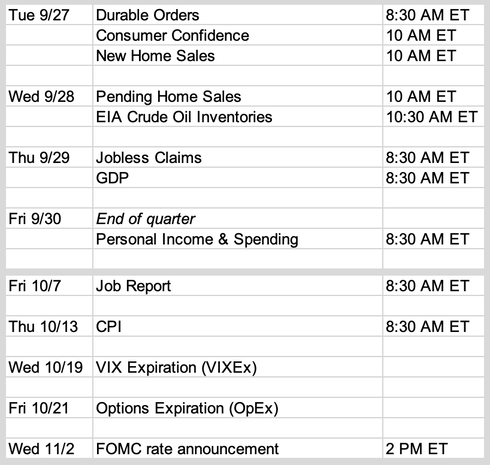 Summary: big-picture is very bearish but a short-term bounce is possible Stocks continue to be in a very bearish trend in the big picture context, from both fundamental and technical perspective. But market may not gap down on Monday, and instead may spend the first half of this week building a short-term bottom ahead of GDP Thursday. Fundamentals are very bearish
Volatility: $VIX has taken off $VIX weekly chart below shows its 20-week EMA blue line starting to head up this past week, after going sideway for multiple weeks. This is significant as it's the type of pattern that can persist, rising higher and higher. We may see $VIX rise as high as 38 by early October. 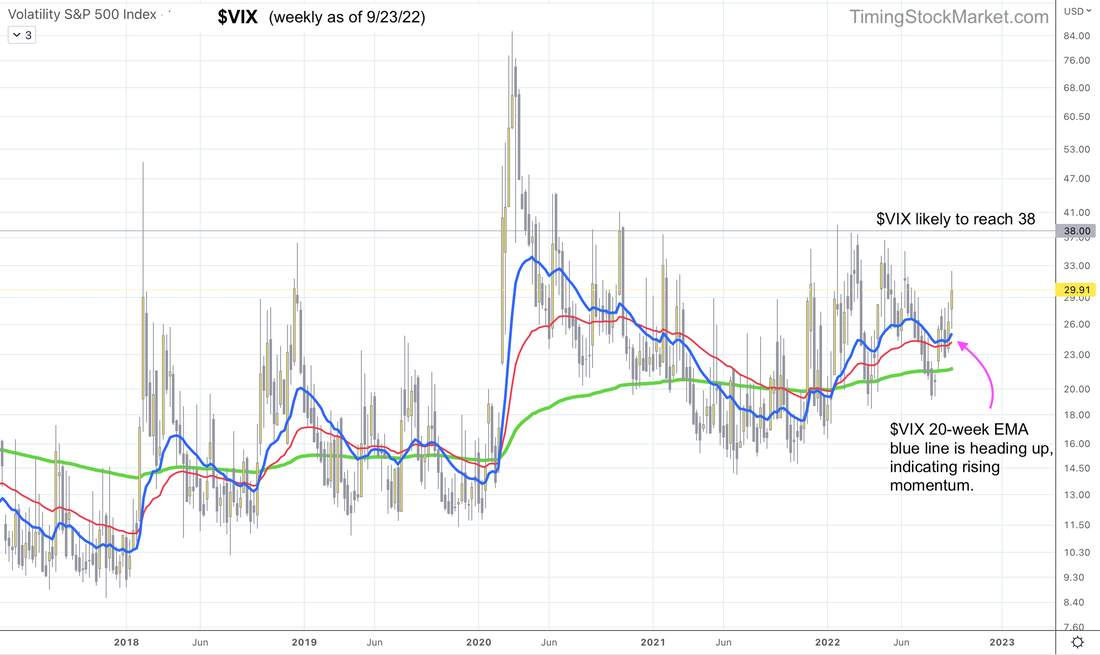 Market breadth is bearish but may be approaching short-term bottom Below is the daily chart for NYSE Advance-Decline Net Issues. Its 20-day EMA line is in bold blue, and you can see how it's looking mightily bleak, dropping sharply since mid September. However, observe the pattern formed by this same 20-day EMA blue line back in March 2020. The current 20-day EMA blue line suggests that we may be approaching the start of a bottoming process, which supports the possibility of a short-term bounce. 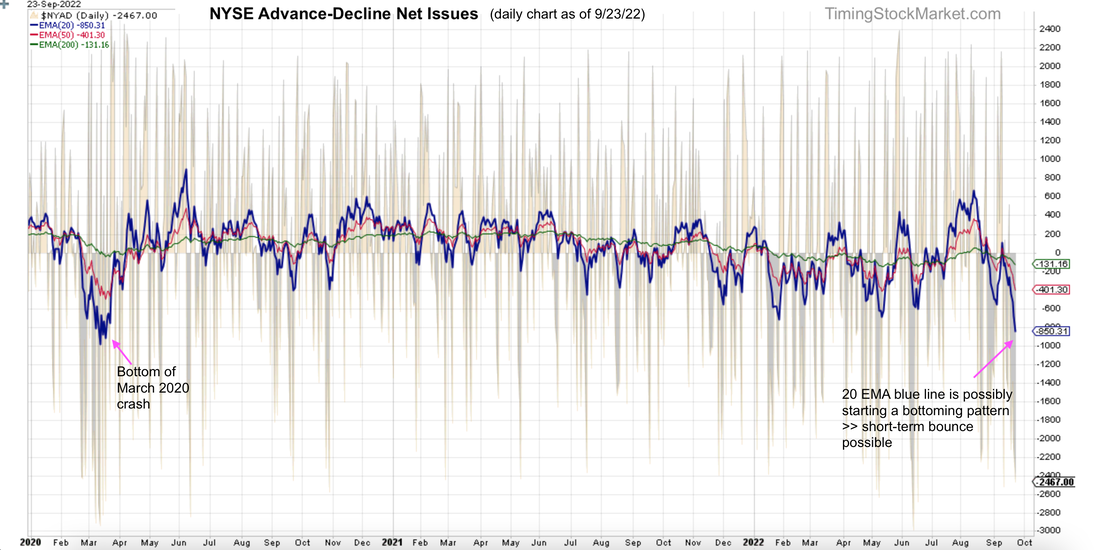 Additionally, here are the percentages of stocks above their 200-day MA:
Clues that will foretell the next market move For the early part of this week, there are three scenarios to anticipate. Scenario 1: Market has an immediate crash that takes ES NQ RTY sharply below 6/16 lows. The clue to look for here is heavy and steady selling from Asia and Europe during the late Sunday into early Monday (Eastern Time zone). Scenario 2: ES NQ RTY take a little pause and then resume the selling, dropping to below 6/16 lows. The clue to look for here is ES NQ RTY rising from Friday's low (S1) to tag 1st resistance level (R1), and then drop, and keep dropping past 6/16 lows. Scenario 3: ES NQ RTY start to form short-term bottom for a minor to moderate bounce. The clue to look for here is ES NQ RTY rising from Friday's low (S1) to tag 1st resistance level (R1), and then drop, and find support to bounce at 6/16 lows. Note that in order for the bullish scenario 3 to take place, ES NQ RTY have to form bottoming patterns like these shown below. The pattern can be seen most clearly with the 20 EMA blue lines on the 2-hour charts. 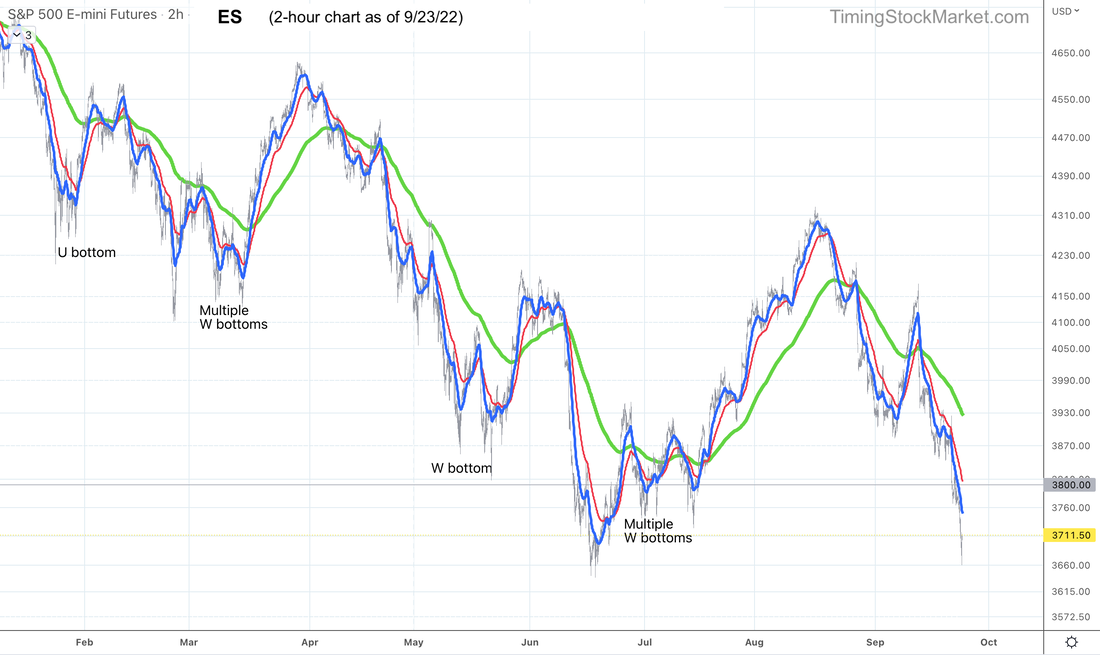 Key S/R levels  Trade plan Click here for live trades. Subscribe to get our latest analysis, daily trade plans and live intraday trades. Current trade record here. Disclaimer The information presented here is our own personal opinion. Consider it as food for thought. We are not offering financial advice. We are not promoting any financial products. We are not registered financial advisers or licensed brokers. We make no guarantee that anything will unfold according to our projections. You are proceeding at your own risk if you follow our trades.
0 Comments
Leave a Reply. |
Archives
July 2024
Categories |
 RSS Feed
|
|
Copyright (c) 2019-2024 LOOK Systems LLC
All rights reserved. |