Updates 12:47 PM ET - Friday 10/21/22 Volatility and Breadth are supportive of stocks
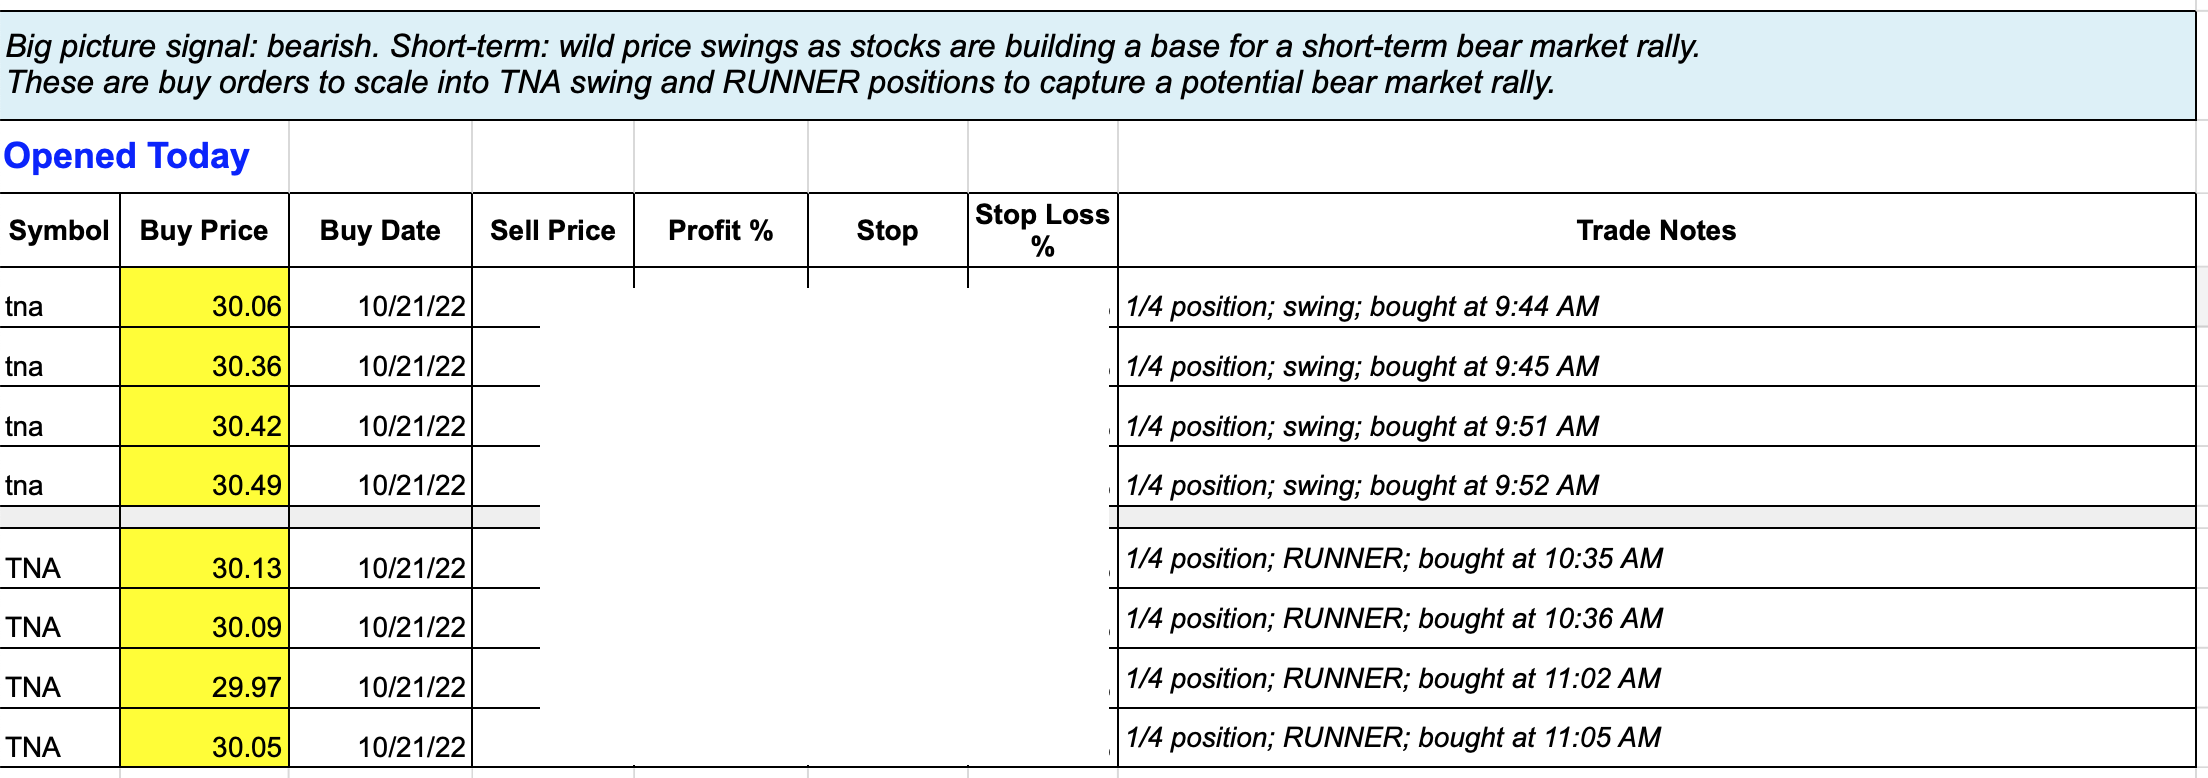
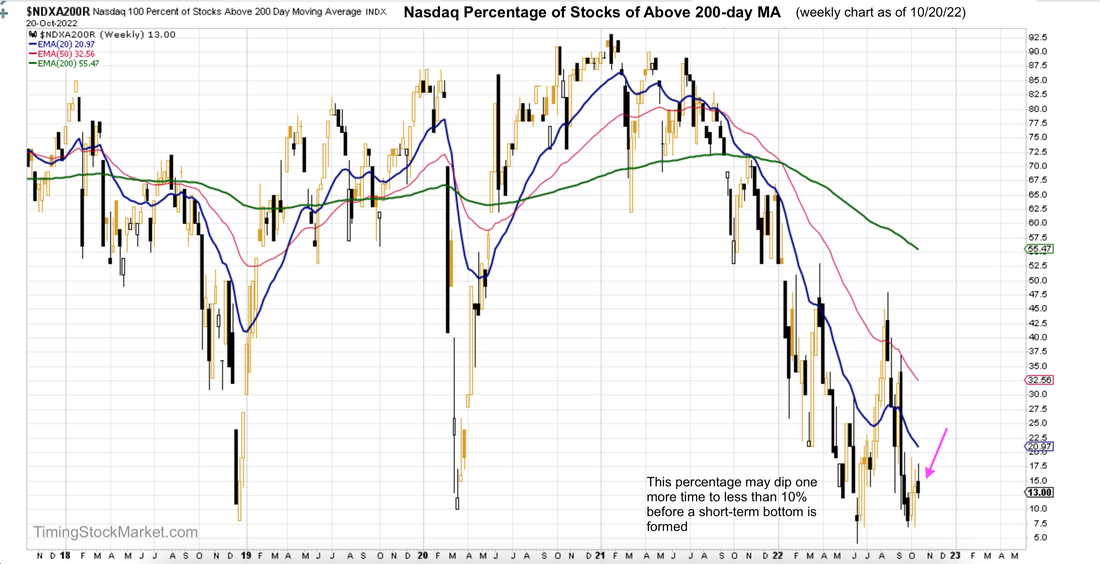
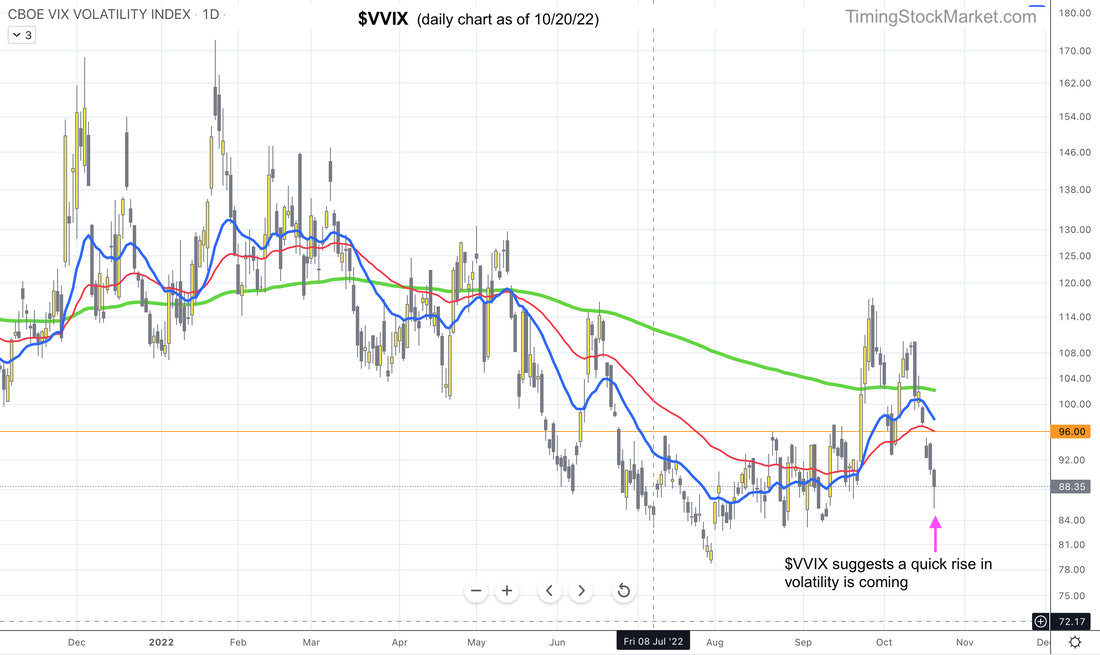
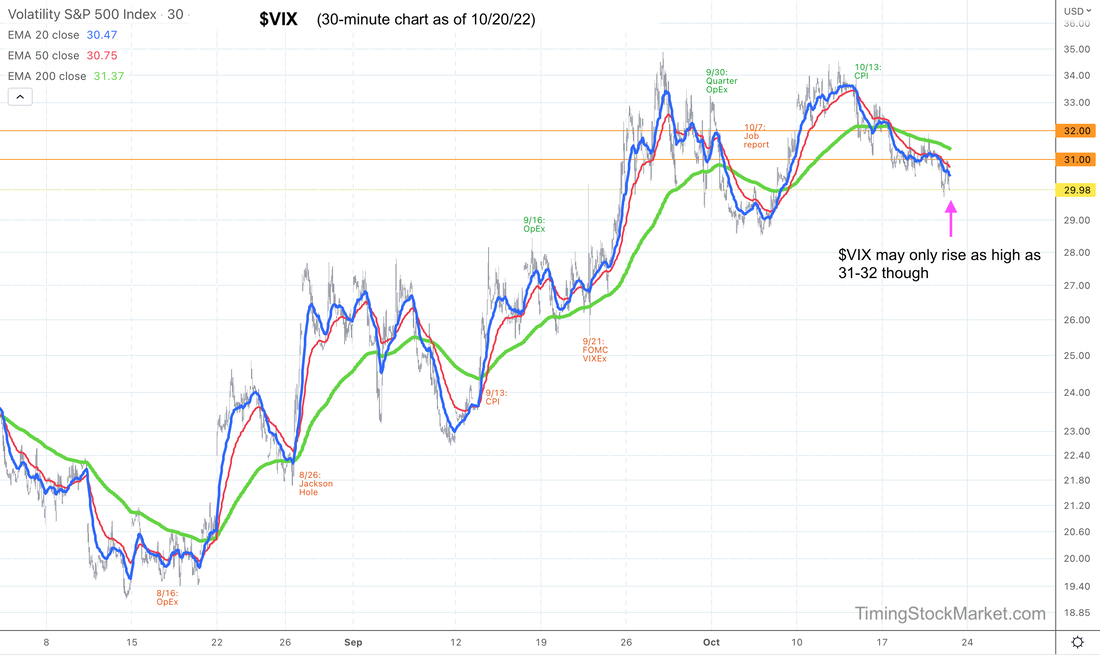
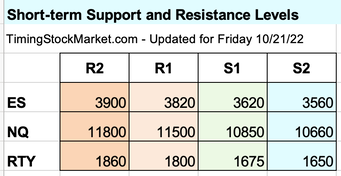
RTY has formed W bottom ES NQ RTY all rose this morning from the opening lows. RTY hourly chart continues to show a complex rising W bottom similar to the one formed between May and June. We sent out a series of alert as soon as we noticed that $VIX was continuing to drop and ES NQ RTY were turning bullish at opening. They didn't dip into the support zones that we cited last night. That is the nature of trading. It's very difficult to predict the pivot points. But we have been prepping you to visualize a bullish W bottom being formed. We showed you what to look for with $VIX and market breadth to confirm the thesis. And we said OpEx Friday is likely to be the major pivot day. So it should come as no surprise that ES NQ RTY headed up today. Here are the entries that we scaled into. Keep in mind that there will be wild intraday swings as $VIX is still yearning to rise up and tag 30 one more time. Also as long as ES is still below 3800, the way market makers have to hedge their books result in wild price swings as they need to sell into weakness and buy into strength. Once ES rises above 3800 (R1), price should calm down and start to grind up more steadily. Updates 12:15 AM ET - Friday 10/21/22 Summary Big picture signal is bearish based on macro conditions. But short-term signal is still bullish. ES NQ RTY are building W bottom to rise post OpEx. Market breadth continues to improve, but... The daily charts of NYSE and Nasdaq A/D net issues are still forming rising bottoms. However, the weekly charts of NYSE and Nasdaq percentage of stocks above 200-day MA suggest they are capable of dipping a bit more before rising more substantially. Nasdaq weekly chart below shows a topping pattern so far for this week, while the percentage hovers at 13%. It could dip back to below 10% before rising again. Volatility of $VIX shows a quick rise in volatility likely $VVIX formed a hammer on its daily chart below on Thursday. It is the type of pattern typically seen before $VVIX rises a bit, possibly back up to 95 before dropping again. $VIX may not retest that high Despite these cautions, we don't think will rise back up to 34 at this point. On $VIX 30-minute chart below all of its EMA lines have been trending down. $VIX is likely to tag 32 again before dropping more substantially. Key S/R levels
Trade plan Our buy orders placed yesterday are still the same. Subscribe to get our latest analysis, daily trade plans and live intraday trades. Current trade record here. Disclaimer The information presented here is our own personal opinion. Consider it as food for thought. We are not offering financial advice. We are not promoting any financial products. We are not registered financial advisers or licensed brokers. We make no guarantee that anything will unfold according to our projections. You are proceeding at your own risk if you follow our trades
0 Comments
Leave a Reply. |
Archives
July 2024
Categories |
 RSS Feed