Updates 5:15 PM ET - Monday Scaled into bull position SVIX Per our analysis last night, we scaled in when SVIX dipped in the morning. Our target for this trade is 10% gain. 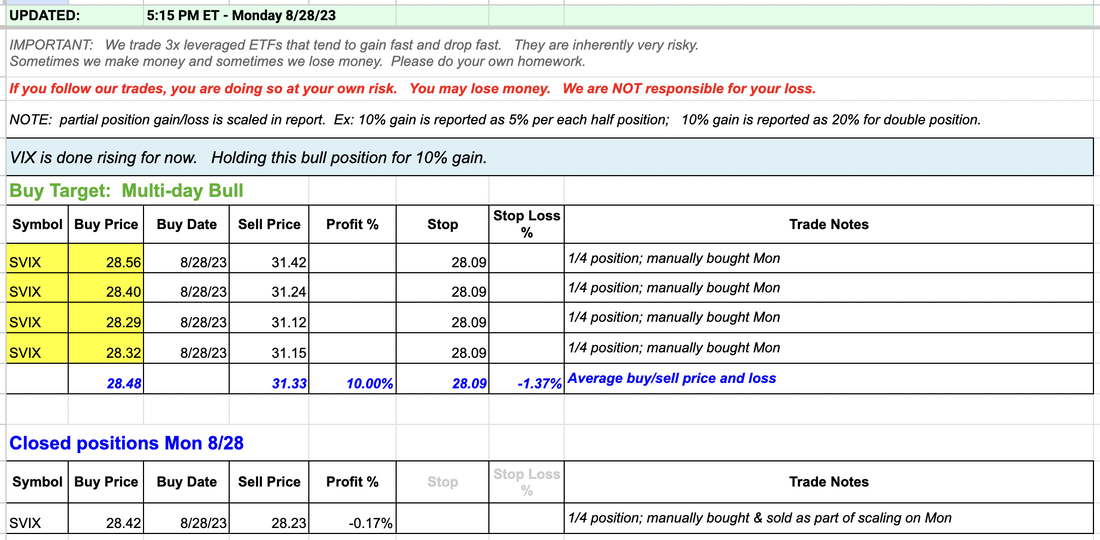 Updates 12:50 AM ET - Monday Upcoming key events This week is filled with economic data that is likely to move the market sharply. 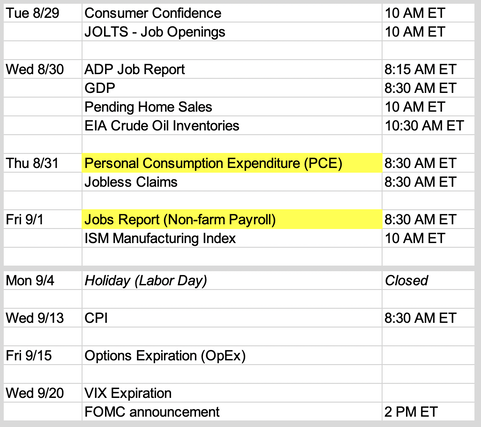 Big picture outlook: Da bull is back? In preparation for Aug 21, we shared with you a big picture analysis. We were worried about VVIX (volatility of VIX) forming the dreaded "Coiling Towards Catastrophe" pattern on its weekly chart. Market breadth confirmed this bearishness by continuing to drop. By end of day Aug 25, a different picture emerged, one that is much more bullish. Let's take a look at the indicators. Market breadth charts formed W bottom >> bullish support By Friday, the 15-minute charts of S&P and Nasdaq percent of stocks above 200-day MA ((Stockcharts: $SPXA200R $NDXA200R) showed a clear W bottom. S&P grazed 50%, and Nasdaq grazed 62%. They both then stabilized and turned up. This suggests that stocks may be done with the big drop for now. 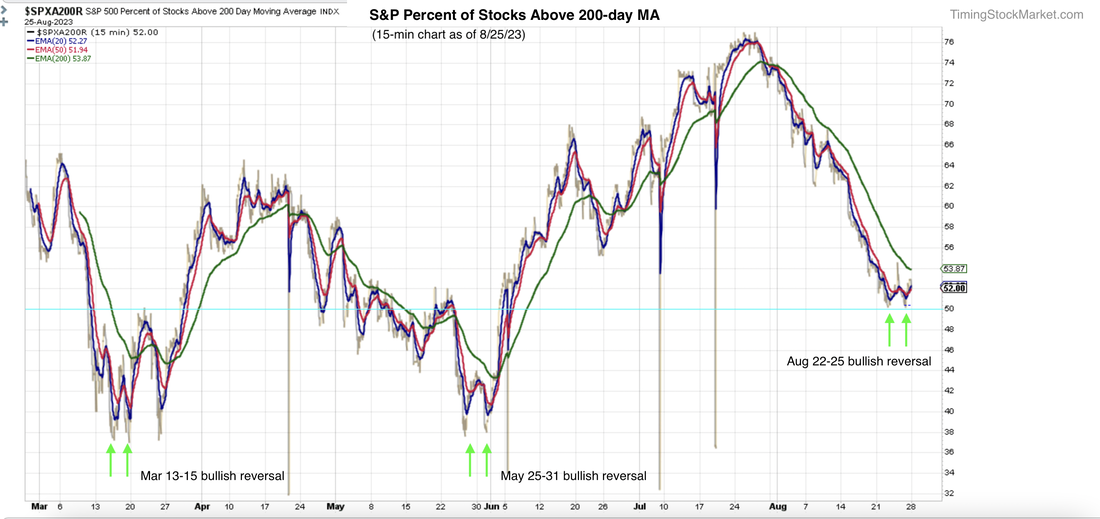 "Coiling Towards Catastrophe" signal failed >> bullish support For last Monday, we wrote an in-depth explanation about the big bearish signal from VVIX which we dubbed "Coiling Towards Catastrophe". By end of week on Friday Aug 25, this signal failed to materialize. VVIX 20-week EMA blue line failed to cross over the 50-week EMA red line. A key failed signal is always significant. It is saying that there is not that much volatility in the system to push VIX into the stratosphere. Not anytime soon. And after a good size sell-off, a failed bear signal is a healthy bull signal.  VIX may be forming a topping pattern >> bullish support VIX has formed a lower high pattern relative to Aug 18 peak. If VIX continues this pattern and its 20-day EMA blue line drops below its 50-day EMA red line, then VIX is on its way possibly to 13 or lower. 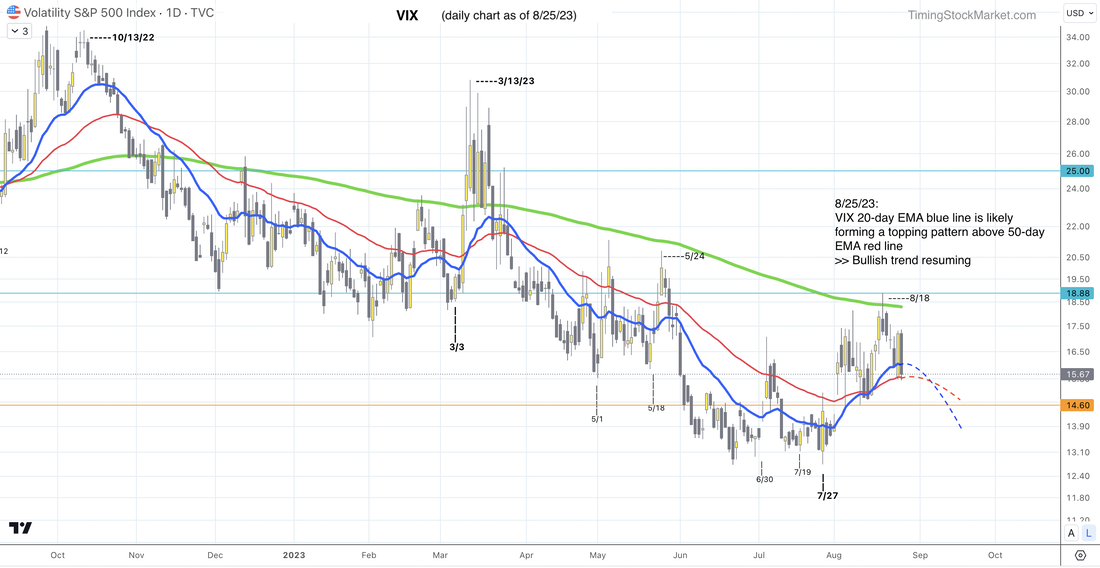 How long will the bull signals last? Here are the key signals that we'll be monitoring to confirm that the bull is back in charge.
If these signals start to fail, then the bull may be in trouble again. But we suspect that market will calm down between now and about mid-September. Then we may see a setup for a bearish volatility surge. However, at this point we are not sure if this September surge will send VIX above 19. If VVIX keeps grinding downward, then conditions will still lean bullish. But if VVIX anchors and starts to rise, then the bear is likely back and may come back with a vengeance. Key S/R levels All R1 and R2 lelvels have been updated. Support levels remain the same. If ES NQ RTY retest or get close to S1, that may be a decent setup to enter bull positions. They are likely to reach R1 if bullish conditions persist. They may even rise all the way to R2 by mid September. 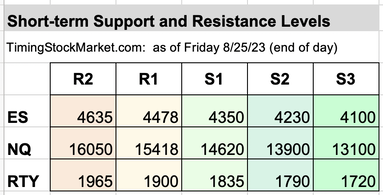 Our personal trade plan We will be looking for a bullish setup to enter SVIX on Monday. See our buy orders in the spreadsheet. Click here for Signal Trades spreadsheet. Disclaimer The information presented here is our own personal opinion. Consider it as food for thought. We are not offering financial advice. We are not promoting any financial products. We are not registered financial advisers or licensed brokers. We make no guarantee that anything will unfold according to our projections. You are proceeding at your own risk if you follow our trades.
0 Comments
Leave a Reply. |
Archives
July 2024
Categories |
 RSS Feed
|
|
Copyright (c) 2019-2024 LOOK Systems LLC
All rights reserved. |