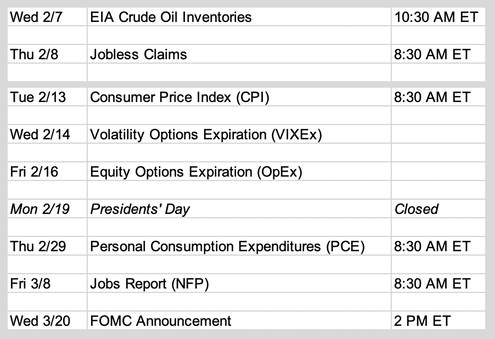
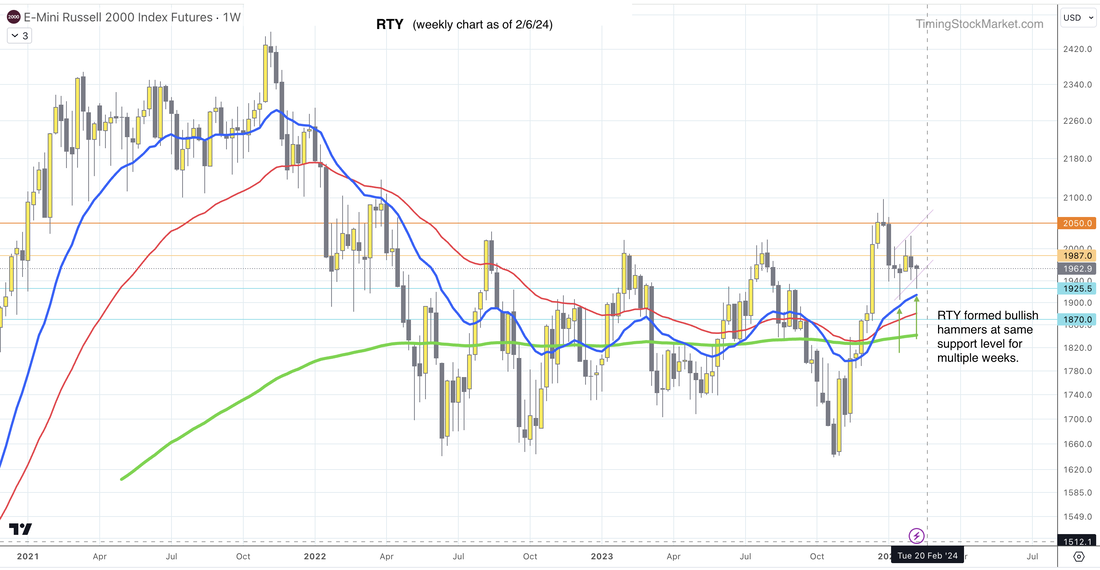
Updates 7:25 PM ET - Wednesday Scaling into SOXL Big picture: bull market; indicators are signaling bullish turn On its 4-hour chart, VIX 20 EMA blue line just crossed below its 200 EMA green line. This is bullish for equity, even if it's just short term. On their hourly charts S&P and Nasdaq Advance-Decline Percents (Stockcharts $SPXADP $NDXADP) are forming W bottom. This implies at least a short-term rise for ES and NQ. McClellan Oscillator for both NYSE and Nasdaq (Stockcharts $NYMO $NAMO) both are forming W bottom on their daily charts via their 20-day EMA lines. This implies at least a short-term rise for ES and NQ. 10-year yield (US10Y) is basing. It may rise from here, but the basing process is going to take some time and meanwhile yield is likely to drop short term. Key S/R levels ES is coiling up and likely to surpass 4997 to reach 5040 given the more bullish messages from the indicators. NQ meanwhile appears to run into resistance at 17775. Failure to rise above 17775 will lead NQ to grind its way downward, eventually down to 17000 for key support post CPI next week. Look for RTY to retest the zone from 1925 - 1935. If it finds enough support here, it will form a W bottom for a big rise up to 2050 eventually. Here's a view of RTY weekly chart which shows bullish hammers at same support level for multiple weeks. Our personal trade plan We are now positioning to scale into TNA if RTY successfully retests support. Click here for Signal Trades spreadsheet. Disclaimer The information presented here is our own personal opinion. Consider it as food for thought. We are not offering financial advice. We are not promoting any financial products. We are not registered financial advisers or licensed brokers. We make no guarantee that anything will unfold according to our projections. You are proceeding at your own risk if you follow our trades.
0 Comments
Leave a Reply. |
Archives
July 2024
Categories |


 RSS Feed