|
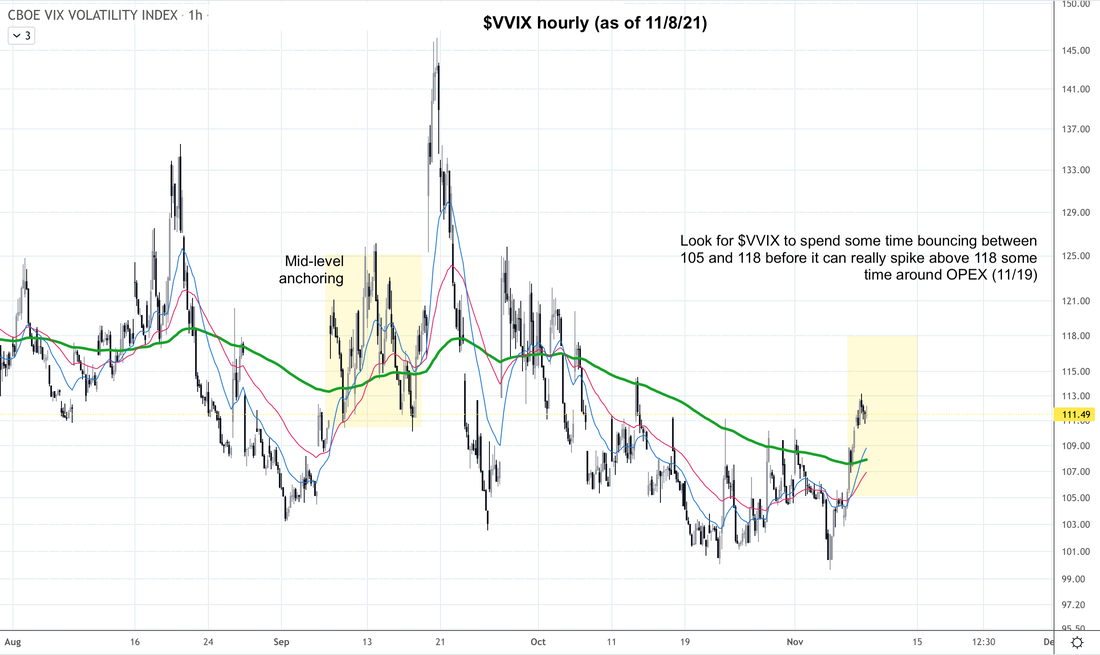
We trade 3x ETFs such as TQQQ TNA SOXL LABU UVXY using proprietary analysis of volatility. Updates 10:51 AM EST - Tuesday 11/9/21 Volatility As we've been anticipating, the minor spike in $VVIX $VIX $VXN $RVX is happening. Pay close attention to $VVIX hourly chart. As we posted earlier this morning, $VVIX is likely to bounce around between 105 and 118 next few days. When $VVIX anchors at the 200-hour EMA green line is when it is likely to really spike. This will most likely happen early next week, ahead of OPEX (11/19). This is where we are likely to exit long, locking in profits for TQQQ TNA. 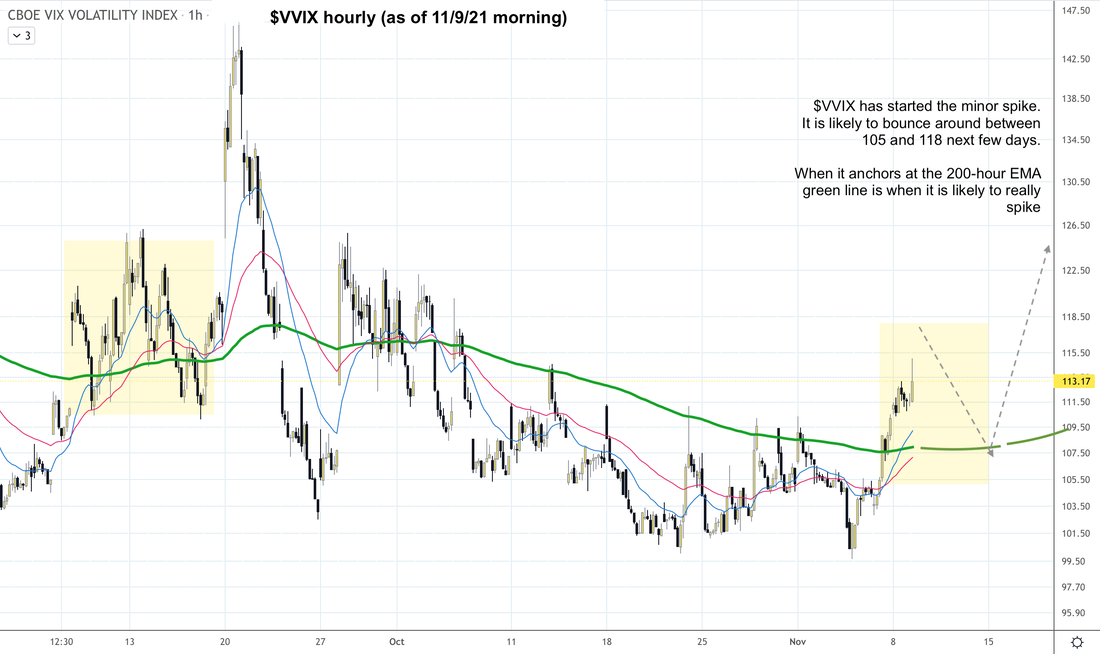 Updates 8:50 AM EST - Tuesday 11/9/21 Volatility >> time to think about locking in profits As we get closer to November options expiration (OPEX 11/19), it's time to monitor $VVIX more closely. $VVIX has a minor spike above its 200-hour EMA green line as anticipated. Now it's likely to spend some time bouncing between 105 and 118 to anchor some more. Then it will be in a better setup to have a moderate spike above 118, around OPEX.
 Equity Put/Call Ratio >> bullish In the P/C ratio 30-minute chart below, keep an eye on the 200 green line. It needs to flatten and go sideway for a few days before it can really spike. So for right now, it is bullish. When this ratio spikes, it means traders are buying more puts than calls in an effort to hedge. That's more bearish. 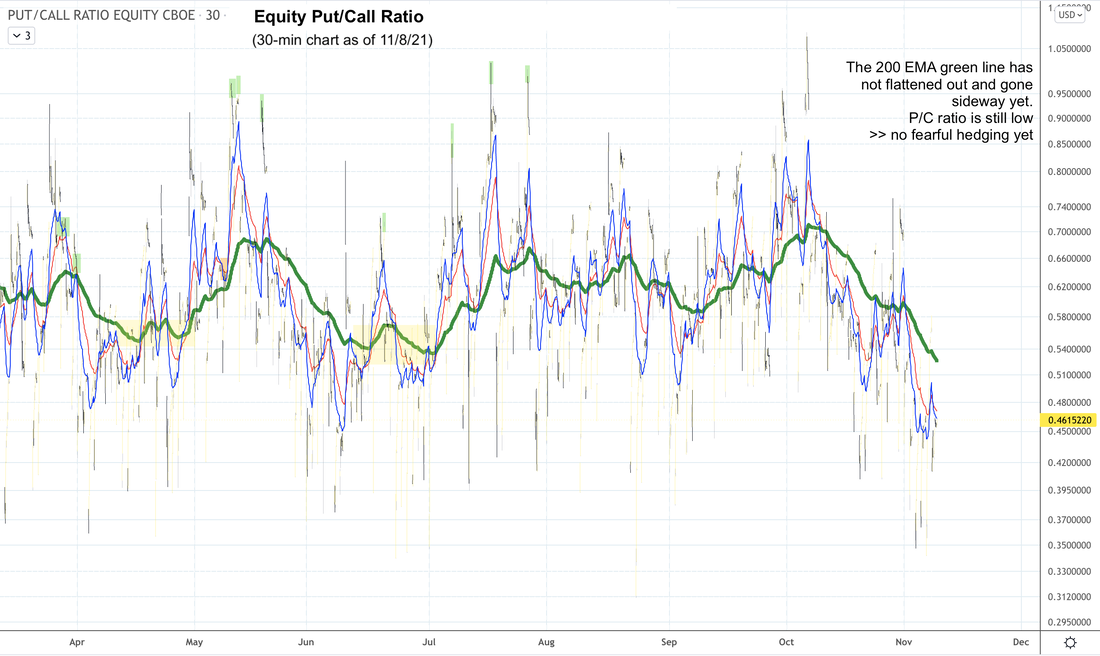 Advance-Decline Net Issues >> bullish NYSE and Nasdaq A/D lines are still above their 200-hour EMA on their cumulative hourly charts. Overall message is still bullish. 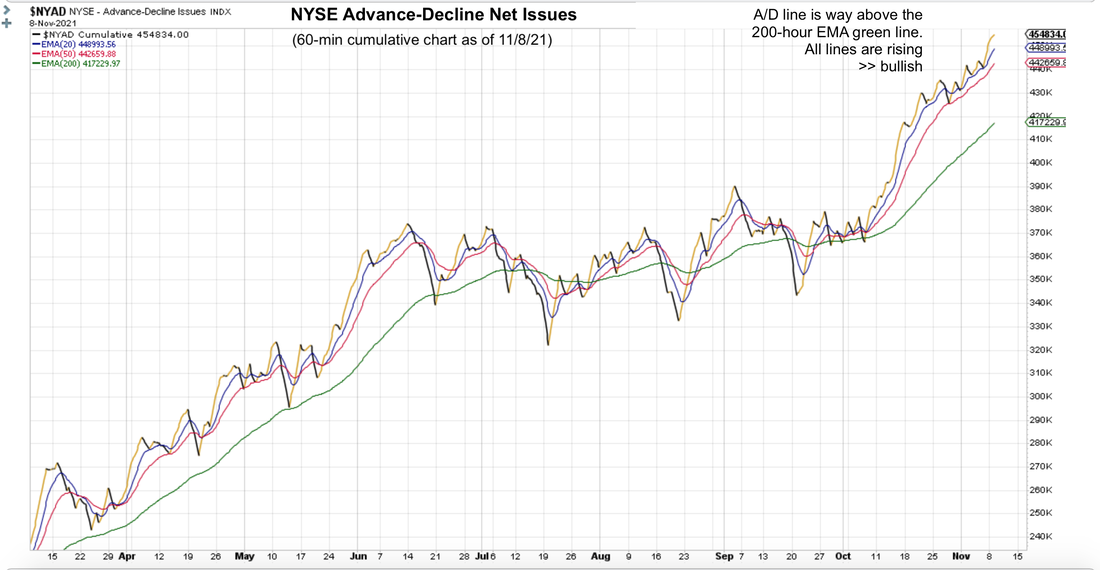 Seasonality >> bullish Statistically, this is a bullish period of the trading year. Short-term Key Levels The table below is still the same. 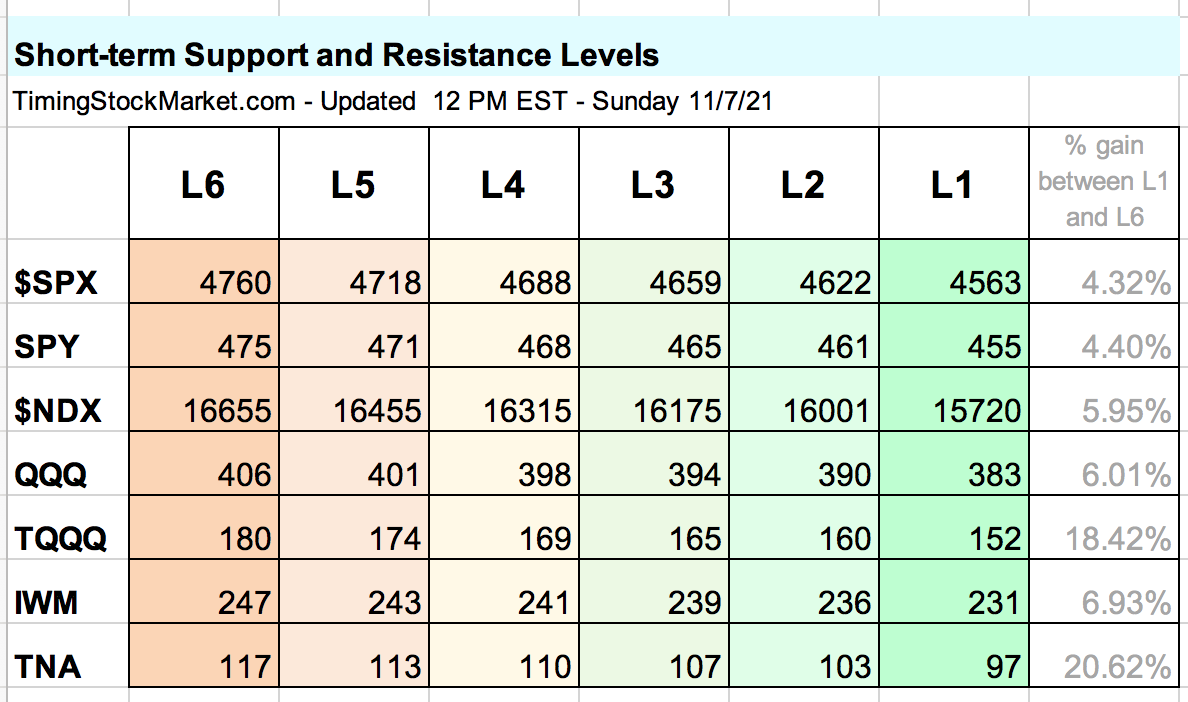 Trade Plan Subscribe to get our latest analysis, trade plan and live intraday trades. Disclaimer The information presented here is our own personal opinion. Consider it as food for thought. We are not offering financial advice. We are not promoting any financial products. We are not registered financial advisers or licensed brokers. We make no guarantee that anything will unfold according to our projections. You are proceeding at your own risk if you follow our suggestions.
0 Comments
Leave a Reply. |
Archives
February 2024
Categories |
 RSS Feed
|
|
Copyright (c) 2019-2024 LOOK Systems LLC
All rights reserved. |