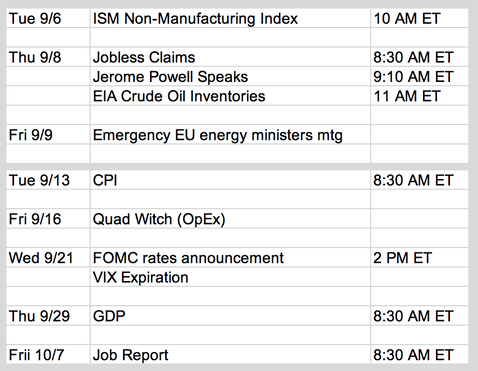
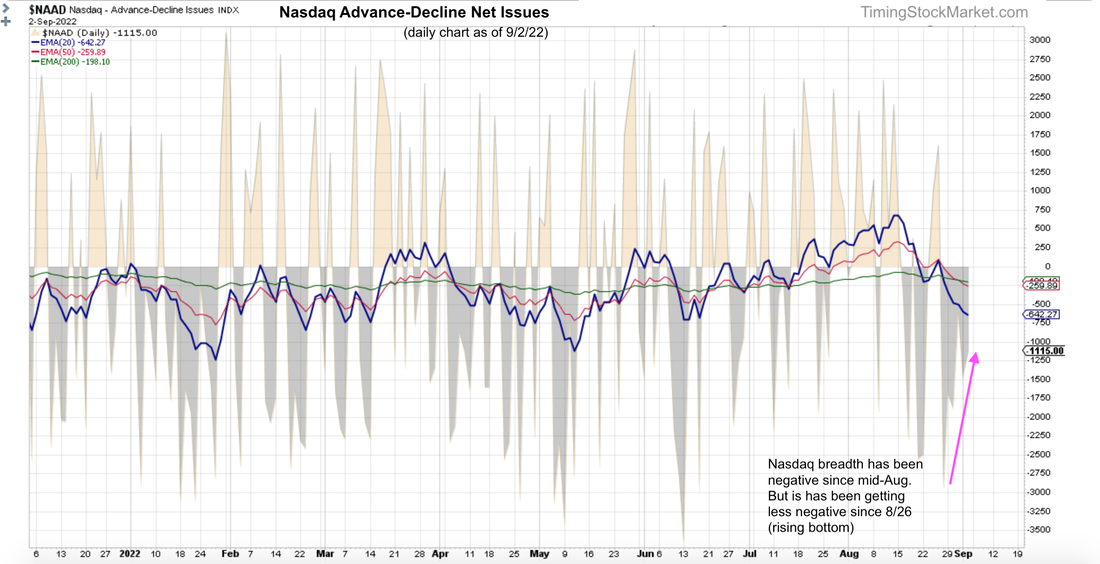
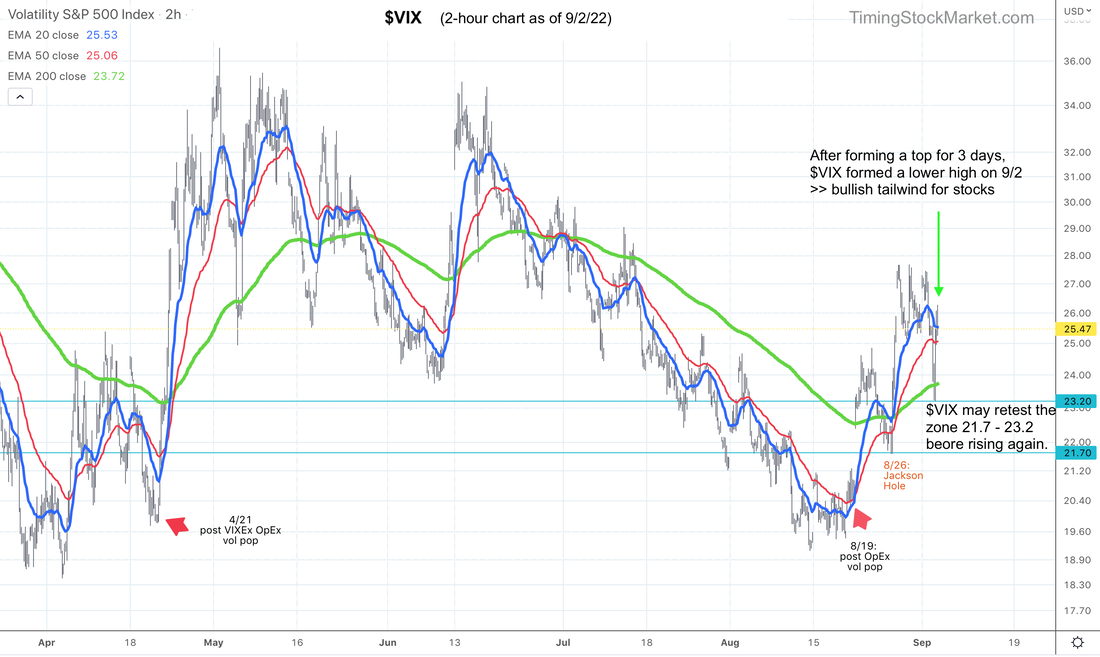
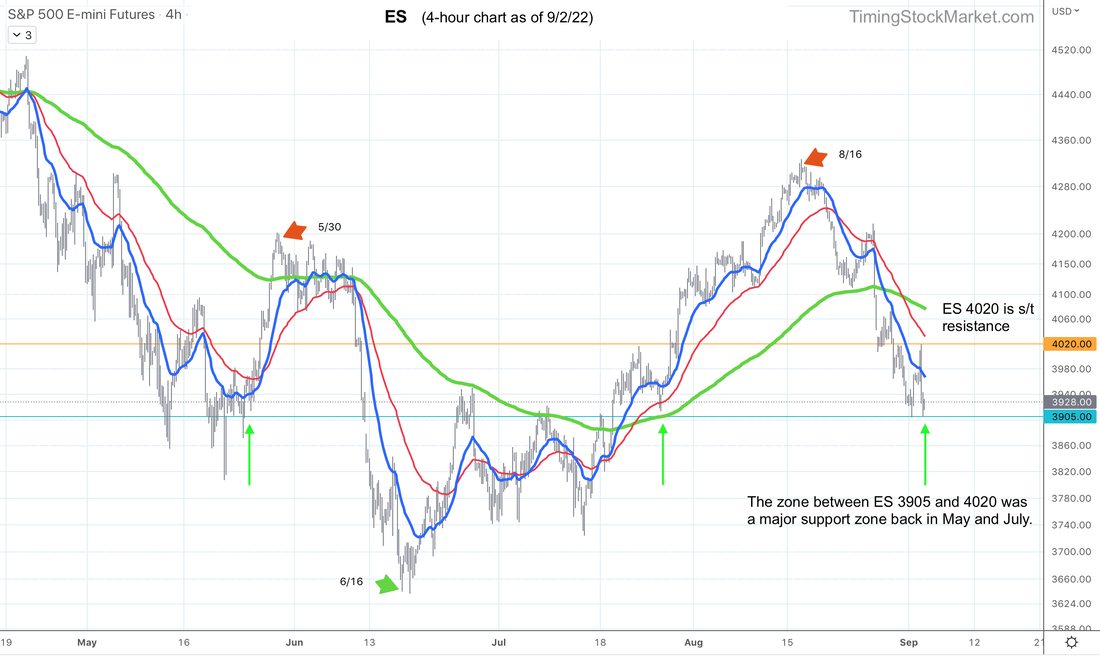
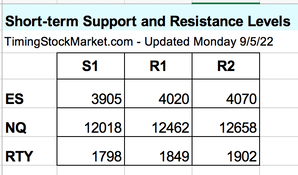
Updates 6:15 PM ET - Monday Upcoming key events Powell's speech on Thursday no doubt will move the market. But a major market pivot is more likely to show up around the quarterly OpEx (9/16), and FOMC plus VIXEx on the same day (9/21). The big picture: bearish Both stock and bond markets seemed to have gotten the very hawkish message from Powell on 8/26 at Jackson Hole: We are serious about fighting inflation and don't try to second guess us. Getting credit and leverage will not be cheap anymore. This means reduced economic activities which leads to reduced corporate earnings. It is increasingly likely that stock valuation needs to come down to the point where S&P P/E is much lower. The numbers suggested by various analysts are all over the map: $SPX 3600, 3200, 3000. The famous Michael Burry ("The Big Short") has sold all of his stocks based on his anticipation of $SPX bottoming at 1900 over the next few years. The truth is no one knows, because no one has the crystal ball that will see all the future events that will affect the economy. There is no doubt the bears are back in charge for now. The current trend is down. The big-picture signal is bearish. However, in the short term, technical conditions are still set up for a bounce. Market breadth supports short-term bounce NYSE and Nasdaq market breadth charts have been very negative since mid August. But as Nasdaq A/D chart below shows, the bottom is rising. In other words, the negative number is getting less negative. This suggests a bounce is likely to come. Note that NYSE and Nasdaq percentages of stocks above their 200-day MA are now back at 25% and 21% respectively. They have dropped a lot since 8/16 (from close to 50%). And they can still drop more. They potentially can spend multiple weeks below 5%. So breadth data is not suggesting that the bear market is done. It is simply saying maybe a bounce is coming this week due to oversold condition. $VIX supports short-term bounce $VIX 2-hour chart below shows that $VIX spent 3 days last week forming a top. Then it formed a lower high pattern on Friday. This pattern suggests that volatility is likely to drop some more before it resumes rising. We may see $VIX retests the zone between 21.7 and 23.2 again. Key short-term price levels ES 4-hour chart below shows the range 3905 - 4020 as a key support zone back in May and July. ES is likely to bounce inside this zone this week. It may even clear 4020 and rises up to 4070. That level 4070 is pretty strong resistance. It's ES 20-week EMA, and where its 20 and 50-day EMA lines are converging. So ES is unlikely to rise above it. Trade plan Click here for live trades. Subscribe to get our latest analysis, daily trade plans and live intraday trades. Current trade record here. Disclaimer The information presented here is our own personal opinion. Consider it as food for thought. We are not offering financial advice. We are not promoting any financial products. We are not registered financial advisers or licensed brokers. We make no guarantee that anything will unfold according to our projections. You are proceeding at your own risk if you follow our trades.
0 Comments
Leave a Reply. |
Archives
July 2024
Categories |
 RSS Feed