|
We trade 3x ETFs such as TQQQ TNA SOXL LABU UVXY using proprietary analysis of volatility. Updates 12 AM EST - Thursday 12/9/21 Read more about $VIX $VXN $RVX $VVIX and the effects of options and hedging on the market here. Hedging by Traders and Dealers Fear evaporated almost as quickly as it arrived. Last week, traders and fund managers were very fearful, and they rushed to hedge by buying puts at a high cost due to super high sudden volatility spike. Dealers had to hedge their books in a way that fueled volatility even more, and caused the melt-down in price. But those expensive puts are tough to hold on to when stocks started to turn slightly more bullish. So traders covered their puts or let them expire. Dealers reversed their hedging in a way that caused a big melt-up in price. Now market conditions have reached a state where gamma is positive. This means dealers will be buying into weakness, and selling into strength. This process dampens volatility and keeps stock prices from melting, up or down. However, FOMC is next Wednesday. Traders and managers will want to hedge for this event some amount. So despite the drop in P/C ratio we saw in the last couple of days, we are likely to see the P/C ratio rise again. In fact, we want to see it rise again, similar to what's shown in the 30-minute chart below. We consider the arrival of this pattern a signal that conditions have turned "Fully Bullish". 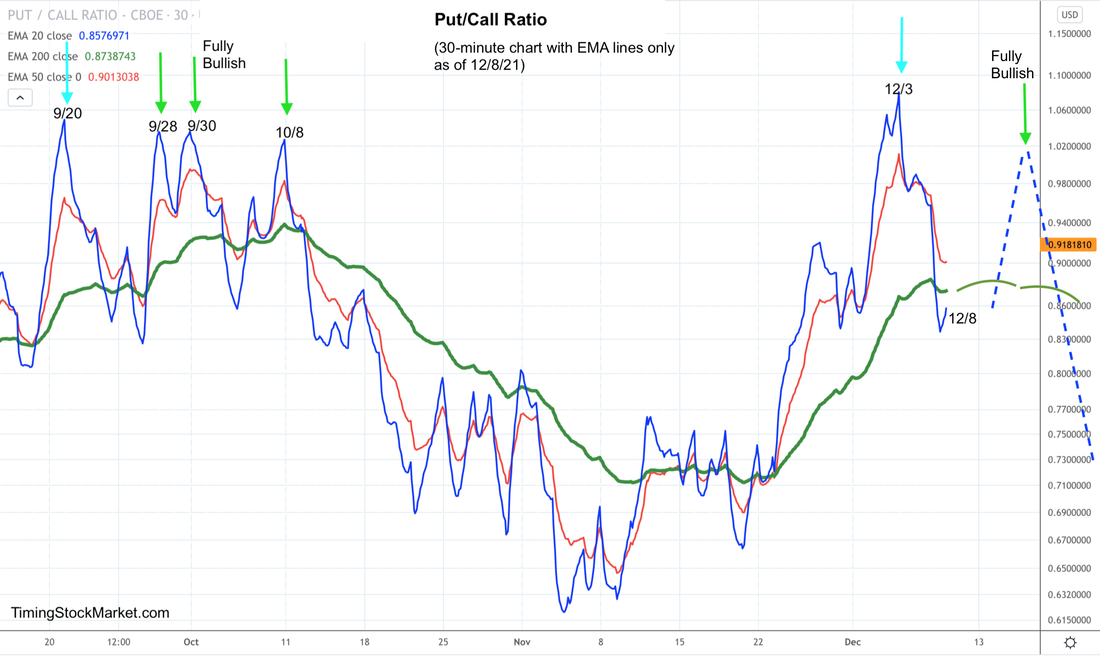 Volatility: $VVIX $VIX $VXN $RVX When traders start buying puts again to hedge FOMC, $VIX $VXN $RVX $VVIX are all likely to rise again, similar to the chart pattern shown below. We want to see that pattern show up, just like P/C ratio chart above. We consider that pattern to be the signal that conditions have turned "Fully Bullish". 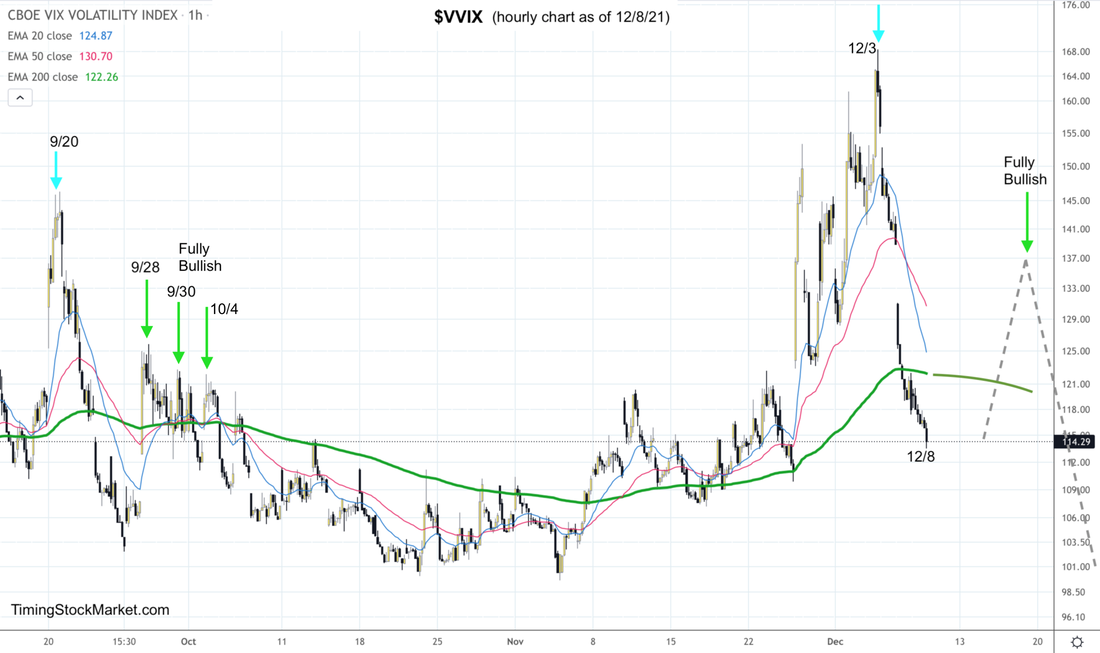 Market Breadth: Advance-Decline Net Issues As discussed we've been discussing for the last few days, the daily charts of A/D net issues for NYSE, Nasdaq and S&P small caps are looking more bullish each day. Below is the daily chart for A/D net issues for Nasdaq. This is the area chart. Observe the W bottoms that is forming. Similar bottoms are forming for NYSE and small caps. This is a "Fully Bullish" signal for market breadth. 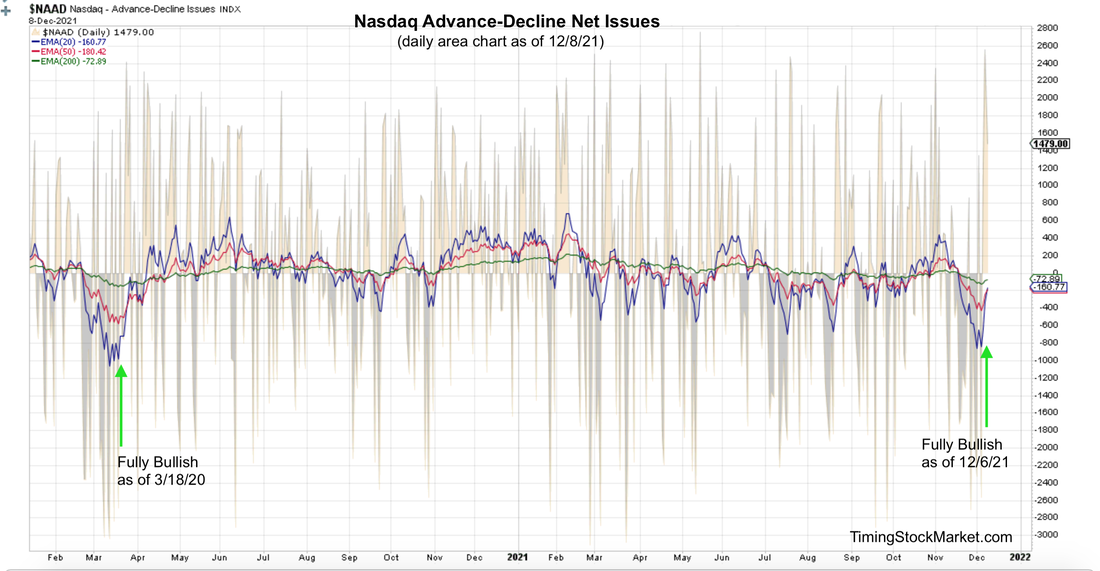 Other Bullish Signals
Short-term Key Levels and Trade Plan Subscribe to get our latest analysis, trade plan and live intraday trades. Current trade record here. Disclaimer The information presented here is our own personal opinion. Consider it as food for thought. We are not offering financial advice. We are not promoting any financial products. We are not registered financial advisers or licensed brokers. We make no guarantee that anything will unfold according to our projections. You are proceeding at your own risk if you follow our suggestions.
0 Comments
Leave a Reply. |
Archives
July 2024
Categories |
 RSS Feed
|
|
Copyright (c) 2019-2024 LOOK Systems LLC
All rights reserved. |