|
We trade 3x ETFs such as TQQQ TNA SOXL LABU UVXY using proprietary analysis of volatility. Updates 8:00 PM EST - Monday Volatility: $VVIX $VIX $VXN $RVX Read more about $VIX $VXN $RVX $VVIX and the effects of options and hedging on the market here. We are still looking for the same key patterns discussed yesterday. Here's what to look for on $VVIX chart.
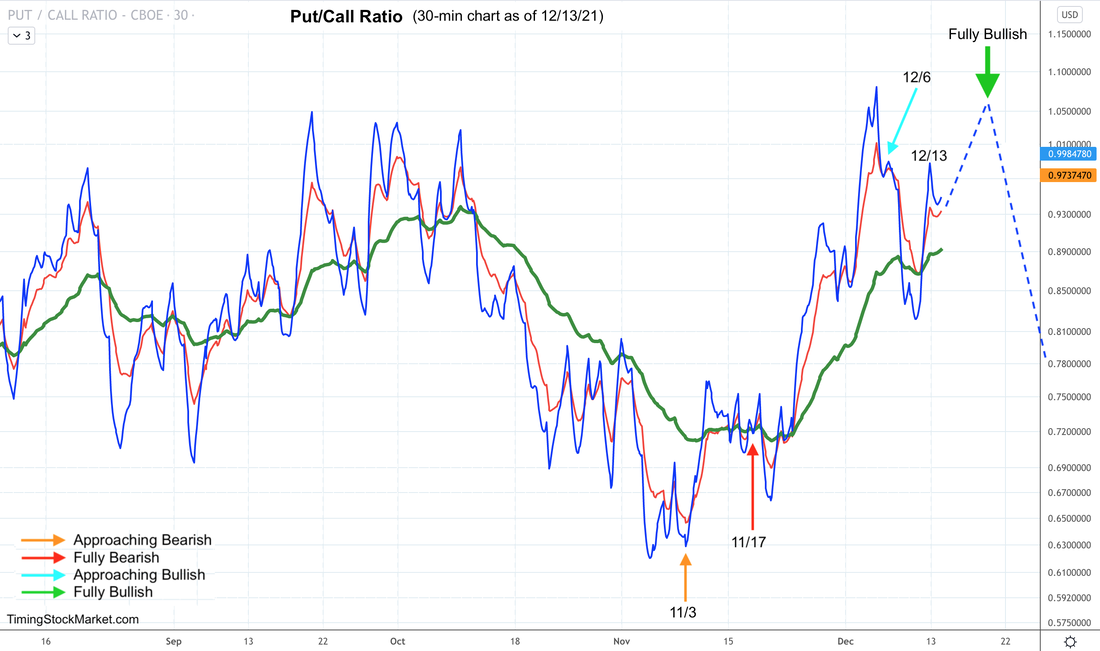
$VVIX is actually the chart that shows the clearest warning pattern as of Monday. It's a W pattern below the 200 EMA green line. That is usually a warning that volatility overall is likely to rise some amount. To be clear, we are not talking about a massive volatility spike that accompanies a market crash. We are just saying there's likely one more volatility spike for $VVIX $VIX $VXN $RVX, and one more dip of some sort for $SPX $NDX IWM some time post FOMC. 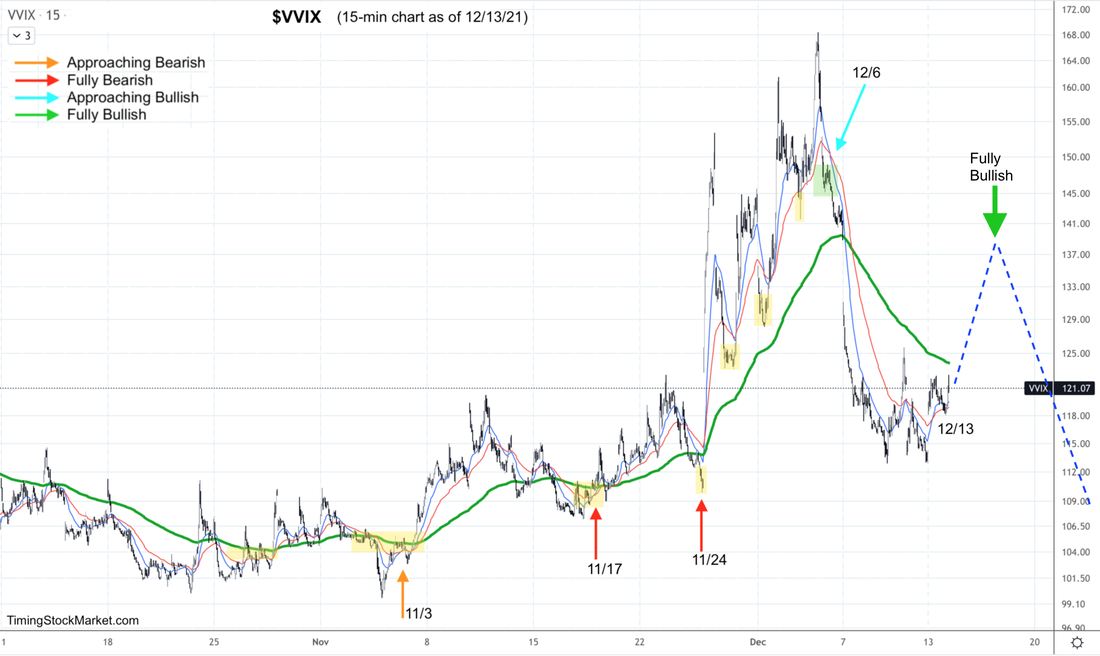 Hedging by Traders: P/C Ratio Even though implied volatility has been dropping, the demand for puts from traders and fund managers are still high, above the 200 EMA green line in the P/C ratio chart below. This is understandable as they want to be hedged ahead of FOMC on Wednesday. Key patterns to look for in the intraday charts of P/C ratio:
 Hedging by Dealers Keep an eye on the following key gamma levels. If prices drop below them, gamma turns negative. This means dealer will hedge by selling into weakness and buying into strength. This action will fuel volatility and causes big price swings.
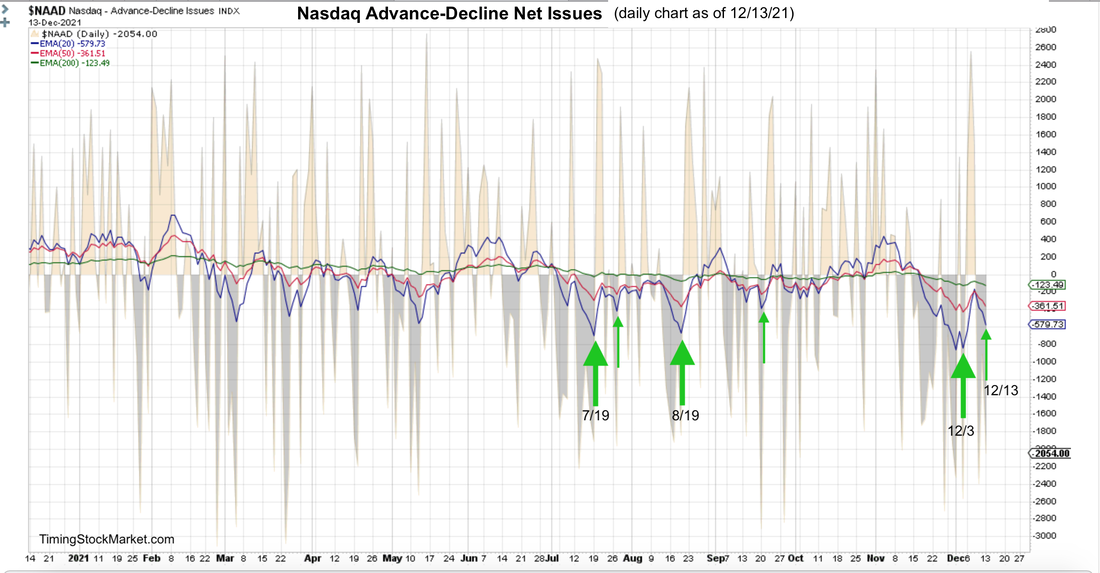
IWM is actually below the key gamma level. This means that gamma for small-caps index is still negative. In other words, big price swings are still likely for IWM. Market Breadth: Advance-Decline Net Issues NYSE, Nasdaq and S&P small caps had been forming big W bottoms since 12/1. The pattern is stalling a bit, but is still intact. Of all the indices, Nasdaq breadth is still the weakest. Below is its daily area chart.
 Other Signals
Short-term Key Levels and Trade Plan Subscribe to get our latest analysis, trade plan and live intraday trades. Current trade record here. Disclaimer The information presented here is our own personal opinion. Consider it as food for thought. We are not offering financial advice. We are not promoting any financial products. We are not registered financial advisers or licensed brokers. We make no guarantee that anything will unfold according to our projections. You are proceeding at your own risk if you follow our suggestions.
0 Comments
Leave a Reply. |
Archives
July 2024
Categories |
 RSS Feed
|
|
Copyright (c) 2019-2024 LOOK Systems LLC
All rights reserved. |