|
We trade 3x ETFs such as TQQQ TNA SOXL LABU UVXY using proprietary analysis of volatility. Subscribe to get our latest analysis, trade plan and live intraday trades. Current trade record here. Updates 12:30 AM EST - Thursday 12/16/21 Volatility: $VVIX $VIX $VXN $RVX Read more about $VIX $VXN $RVX $VVIX and the effects of options and hedging on the market here. We've been describing that we want to see all volatility charts form lower highs. That's a ”Fully Bullish” signal. And that's what we got post FOMC Wednesday. 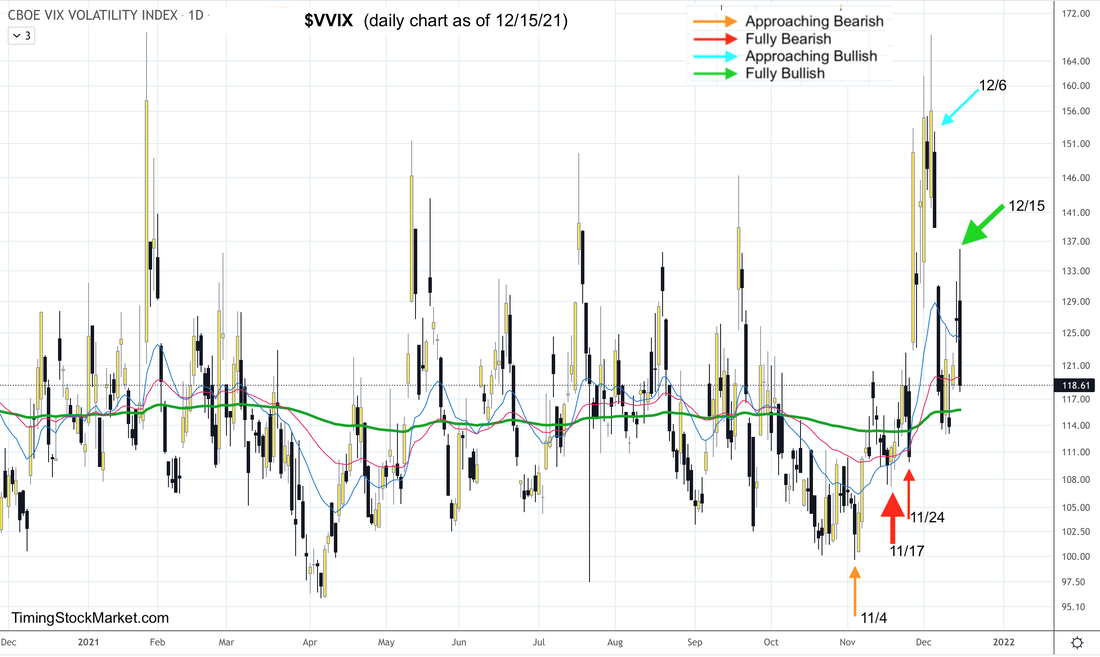 Hedging by Traders: Put/Call Ratio We also wanted to see similar pattern on the Put/Call ratio chart. Such pattern is a ”Fully Bullish” signal. And that's what we got post FOMC Wednesday. 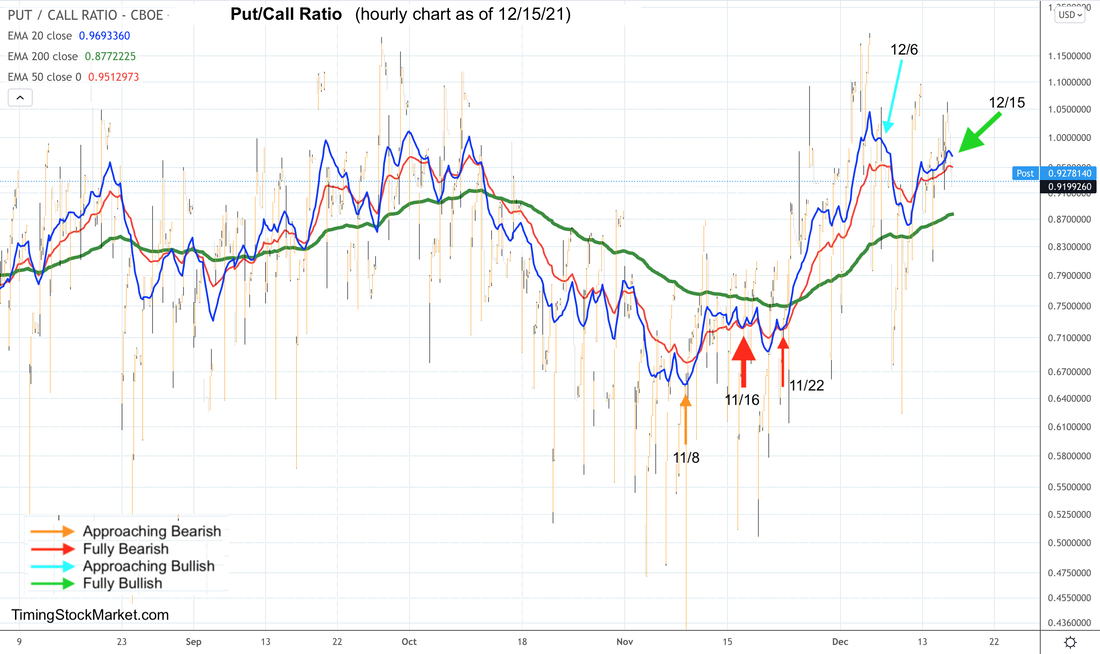 Hedging by Dealers Note that the P/C ratio 20-hour EMA blue line is still above the 200-hour EMA green line. This is bullish. It means there are still puts held by traders. This put inventory is going to expire this OPEX Friday. The subsequent covering of stock and futures hedges by dealers will continue to provide fuel for the Santa Claus rally. Key price levels to keep an eye on. Below these levels, dealer hedging can cause violent price swings. IWM is still in this category.
Market Breadth: Advance-Decline Net Issues NYSE, Nasdaq and S&P small caps had been forming big W bottoms since 12/1. The bullish pattern is still intact. Of all the indices, small caps breadth is actually the strongest in its pattern as shown below. 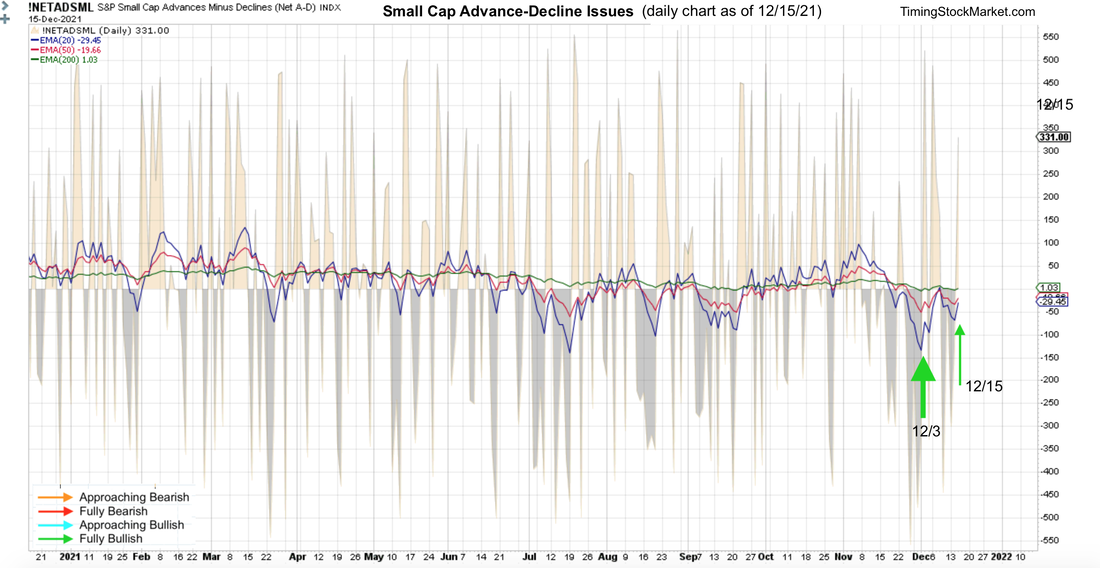 Other Signals
The Dark Pool Index shows that silent money has been buying $SPX since 11/18, and is still buying as of Wednesday 12/15. In addition, they are buying notable amount of QQQ and TNA. Junk bonds (JNK HYG), which tend to behave like $SPX, have been rallying since 12/2. The rally stalled for a bit last week, but has resumed post FOMC. This is bullish for $SPX. Short-term Key Levels and Trade Plan Subscribe to get our latest analysis, trade plan and live intraday trades. Current trade record here. Disclaimer The information presented here is our own personal opinion. Consider it as food for thought. We are not offering financial advice. We are not promoting any financial products. We are not registered financial advisers or licensed brokers. We make no guarantee that anything will unfold according to our projections. You are proceeding at your own risk if you follow our suggestions.
0 Comments
Leave a Reply. |
Archives
July 2024
Categories |
 RSS Feed
|
|
Copyright (c) 2019-2024 LOOK Systems LLC
All rights reserved. |