|
We trade 3x ETFs such as TQQQ TNA SOXL LABU UVXY using proprietary analysis of volatility. Subscribe to get our latest analysis, trade plans and live intraday trades. Current trade record here. Updates 1:30 PM EST - Sunday Key Dates The stock market will be open this entire week, including Friday 12/31, the last trading day of the year. The economic reports are few this week. 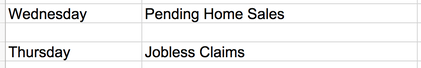 Looking ahead into January, here are some key dates that will definitely move the market. As you can see the latter part of January may get turbulent. January 21: OPEX January 26: FOMC announcement Hedging by Traders: Put/Call Ratio Notice how the 20-hour EMA blue line is still dropping steadily below the 200-hour EMA green line in the P/C ratio chart below. The demand for puts is still declining. This leads to lower volatility, which leads to lesser demand for puts. Conditions remain "Fully Bullish" for now. 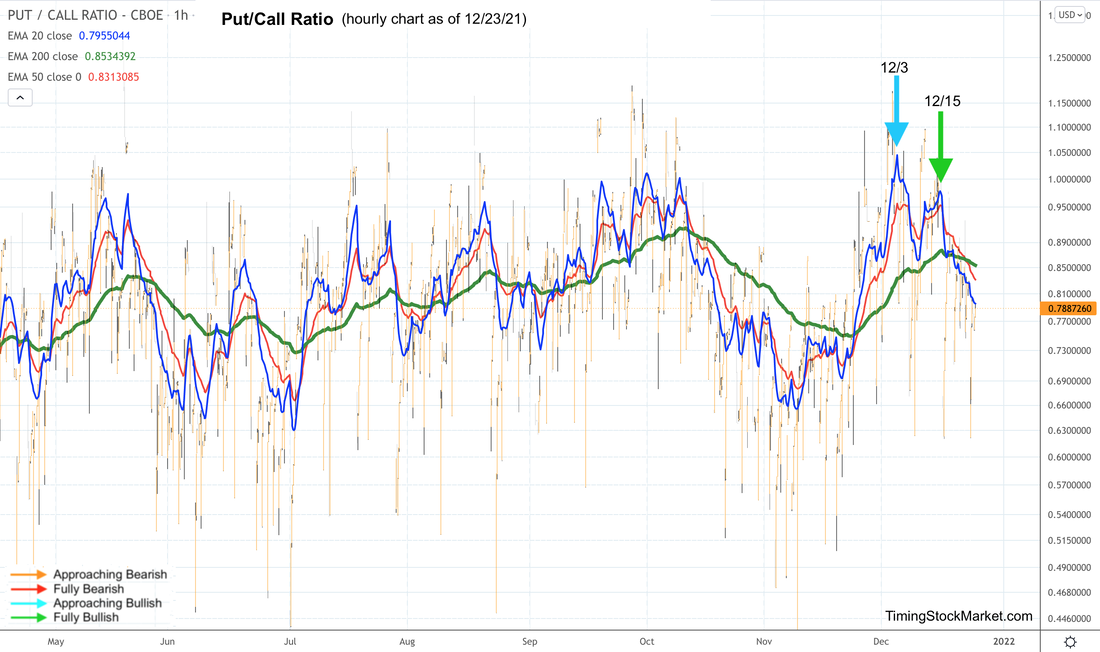 Hedging by Dealers Here are the updated key price levels below which dealer hedging swings from "dampening volatility" to "fueling volatility". Currently $SPX $NDX IWM are all above their key levels. Therefore, we should continue to see the "dampening volatility" effect of dealer hedging.
Volatility: $VVIX $VIX $VXN $RVX Read more about $VIX $VXN $RVX $VVIX and the effects of options and hedging on the market here. As the demand for puts drop, volatility drops. This is most evident in $VIX 30-minute chart below. Observe how the 200 EMA green line has formed a top since 12/3, and has been declining nicely. $VVIX $VXN $RVX charts are all showing similar lower high patterns, confirming their "Full Bullish" signals as well. It would actually be even more bullish if $VIX spikes up early in the week to the zone of 22-23 one more time. That would result in another lower high spike, with the accompanying dips in $SPX $NDX IWM, and the arrival of more buy-the-dip buyers. 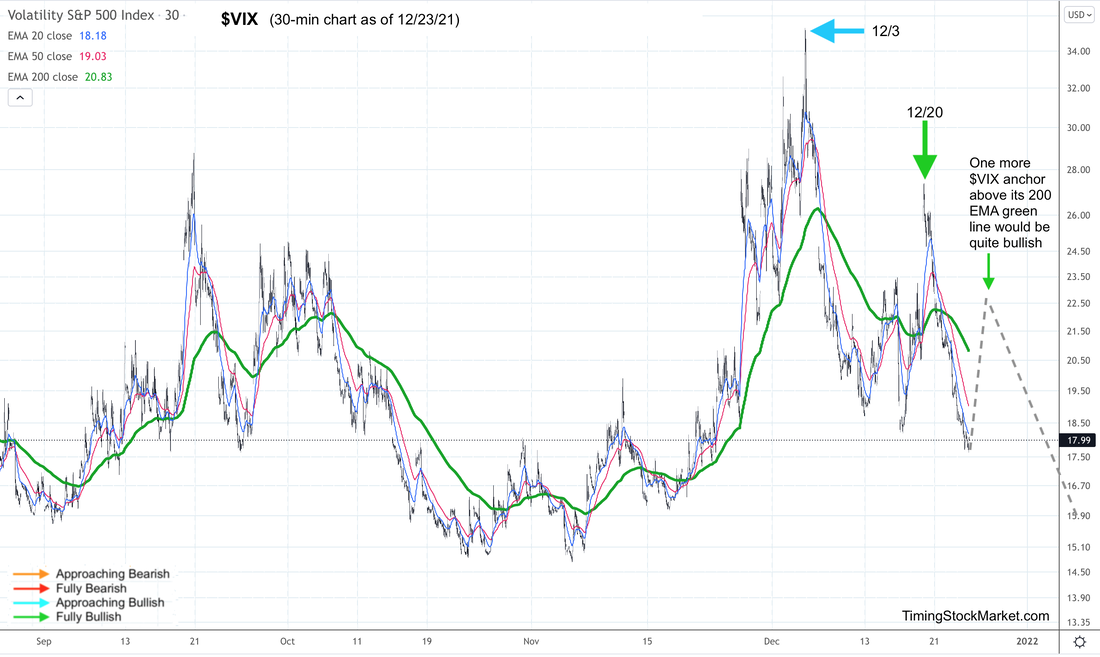 Market Breadth: Advance-Decline Net Issues NYSE, Nasdaq and S&P small caps have been forming big W bottoms (via their 20-day EMA blue lines) since 12/1. This bullish pattern is still intact for all three charts. Here it is shown for small caps. 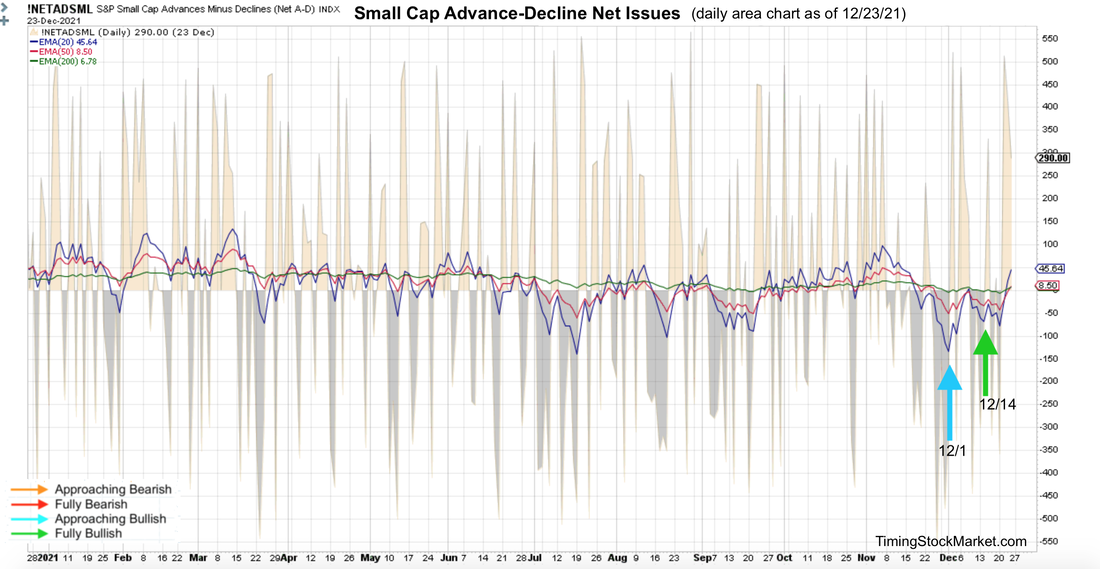 Other Signals
The Dark Pool Index shows that silent money has been buying $SPX since 11/18. However, the buying appears to be ebbing last week, so we'll have to keep an eye on this. Bond volatility (MOVE index) formed another lower high on its chart relative to the level from late November. We consider this bullish for stocks. Junk bonds (JNK HYG) had a very bullish week last week. This indicates a risk-on mood, and bodes well for the stock market. Short-term Key Levels and Trade Plan Subscribe to get our latest analysis, trade plans and live intraday trades. Current trade record here. Disclaimer The information presented here is our own personal opinion. Consider it as food for thought. We are not offering financial advice. We are not promoting any financial products. We are not registered financial advisers or licensed brokers. We make no guarantee that anything will unfold according to our projections. You are proceeding at your own risk if you follow our suggestions.
0 Comments
Leave a Reply. |
Archives
July 2024
Categories |
 RSS Feed
|
|
Copyright (c) 2019-2024 LOOK Systems LLC
All rights reserved. |