|
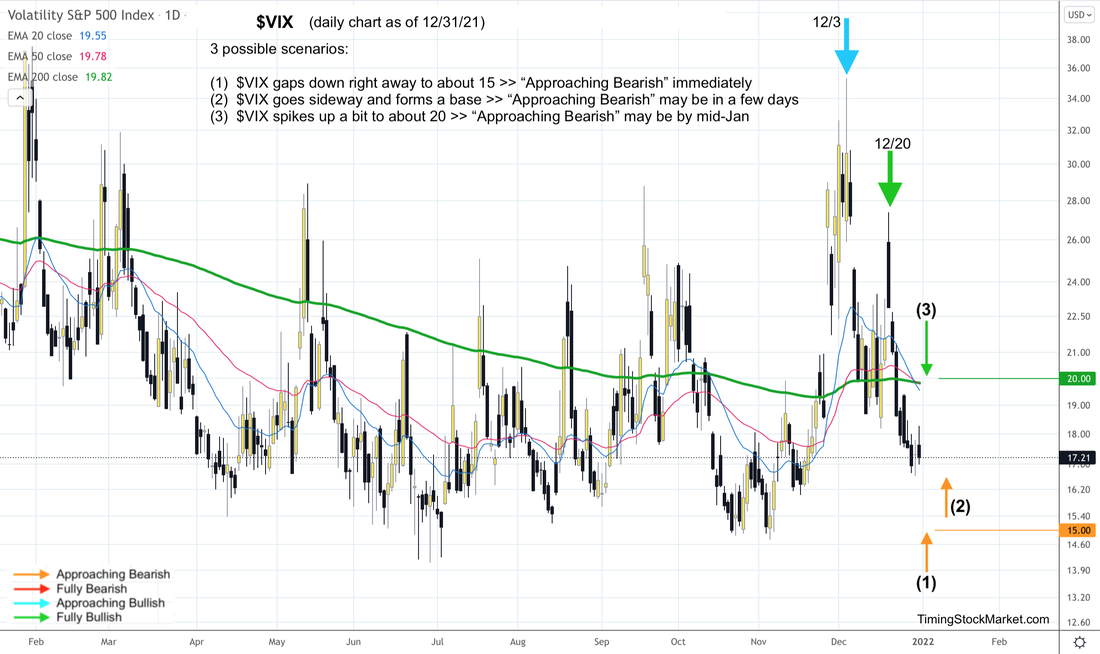
We trade 3x ETFs such as TQQQ TNA SOXL LABU UVXY using proprietary analysis of volatility. Subscribe to get our latest analysis, trade plans and live intraday trades. Current trade record here. Updates 8:00 PM EST - Sunday Key Dates Here is the economic calendar for this week. Friday's job report will no doubt have a lot of impact on the market. 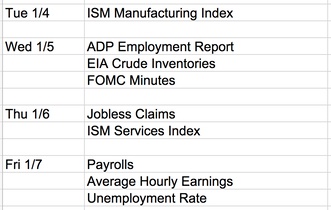 But the big ones will be these two key dates. Fri 1/21: OPEX Wed 1/26: FOMC announcement Volatility: $VVIX $VIX $VXN $RVX Read more about $VIX $VXN $RVX $VVIX and the effects of options and hedging on the market here. Currently the signals from all volatility charts are still "Fully Bullish". There are three possible scenarios that may show up early this week. And each scenario has a different implication. We'll be monitoring for them closely.
 Hedging by Traders: Put/Call Ratio Currently the signal from P/C charts is still "Fully Bullish". What the P/C ratio is showing is that traders and fund managers are not loading up on puts to hedge their long portfolios. Not yet. Using the P/C ratio chart to visually guide us, we still need to wait for at least one W bottom to form (20-hour EMA blue line). This may happen some time early to mid January. When this pattern shows up, then the P/C ratio signal becomes “Approaching Bearish”. 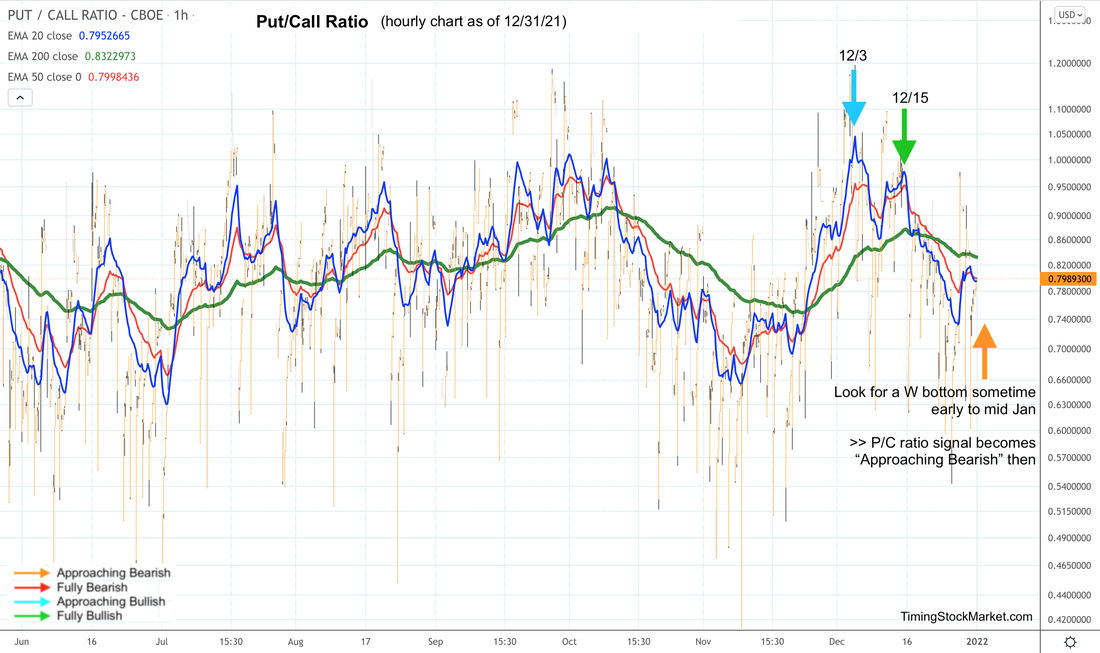 Hedging by Dealers Dealer hedging right now has a "dampening volatility" effect on the market. This is bullish for stocks. Here are the updated key price levels. If $SPX $NDX IWM drop below these key levels, dealer hedging will swing from "dampening volatility" to "fueling volatility".
Market Breadth: Advance-Decline Net Issues Currently the signal from A/D line is still "Fully Bullish". NYSE, Nasdaq and S&P small caps have been forming big W bottoms (via their 20-day EMA blue lines) since 12/1. This bullish pattern is still technically intact for all three charts. Factoring in the possible upcoming changes in volatility and P/C ratio, we would say that if the 20-day EMA blue line turns down and crosses below the 50-day EMA red line, the signal from A/D line may become "Approaching Bearish". 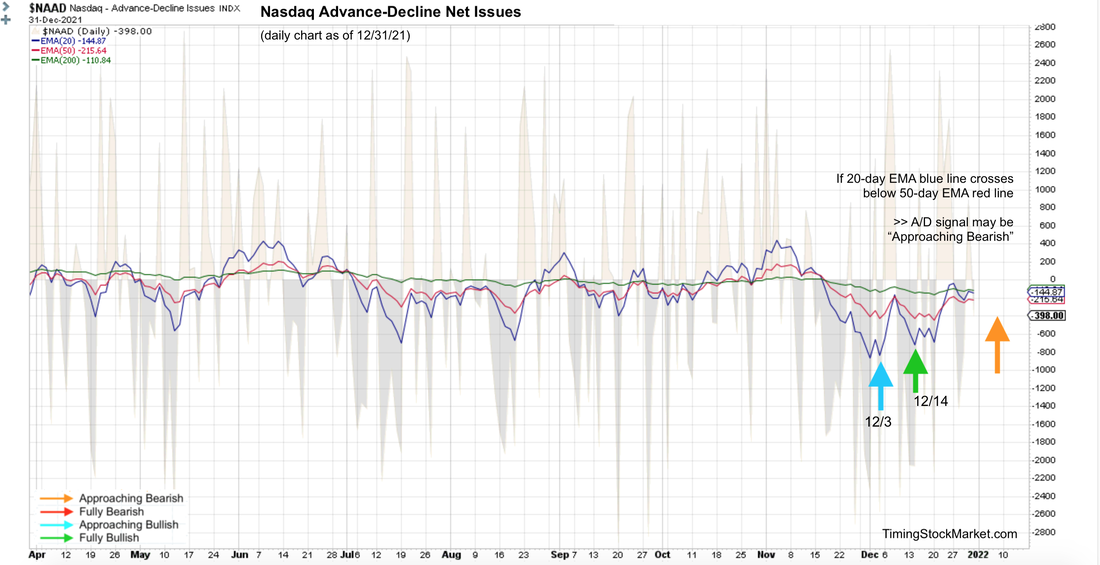 Other Signals The Dark Pool Index shows that silent money has eased up on their buying of $SPX during the entire last week of 2021. This may be an early warning of bearish time to come, but we have to take this information with a grain of salt as it does not track as closely as the other indicators above. Bond volatility (MOVE index) continues to form another lower high on its chart relative to the level from late November. We consider this bullish for stocks. Junk bonds (JNK HYG) is forming a short-term top. Junk bonds tend to behave more like $SPX, so this is not bullish news for $SPX. This is some thing to continue monitoring. Short-term Key Levels and Trade Plan Subscribe to get our latest analysis, trade plans and live intraday trades. Current trade record here. Disclaimer The information presented here is our own personal opinion. Consider it as food for thought. We are not offering financial advice. We are not promoting any financial products. We are not registered financial advisers or licensed brokers. We make no guarantee that anything will unfold according to our projections. You are proceeding at your own risk if you follow our suggestions.
0 Comments
Leave a Reply. |
Archives
February 2024
Categories |
 RSS Feed
|
|
Copyright (c) 2019-2024 LOOK Systems LLC
All rights reserved. |