|
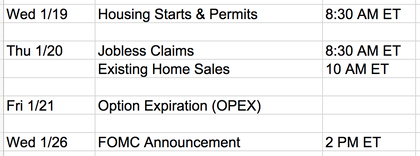
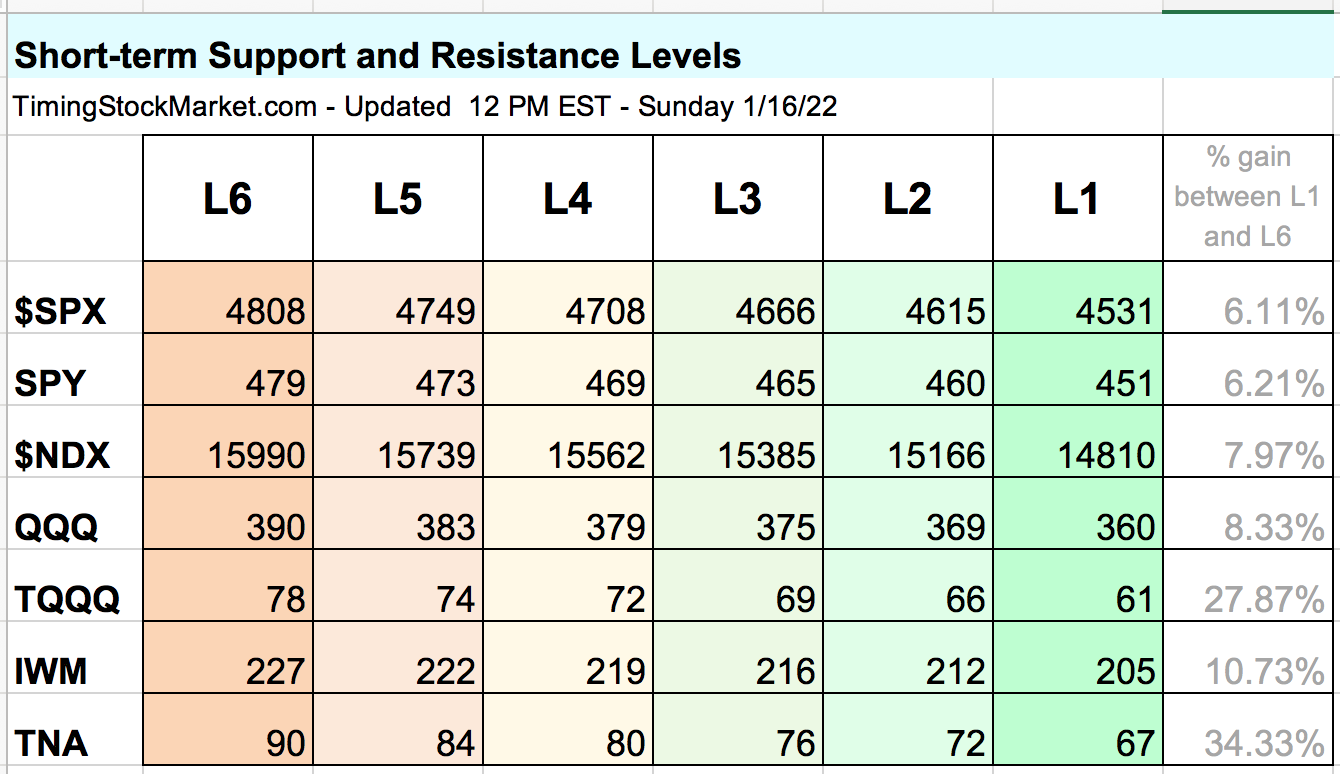
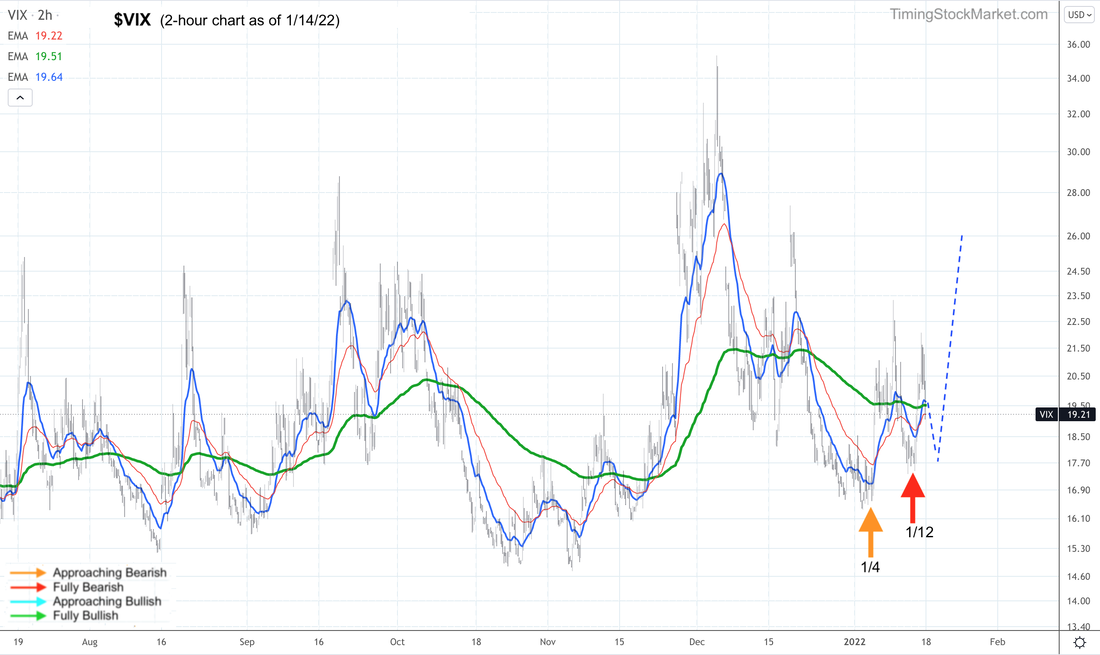
We trade 3x ETFs such as TQQQ TNA SOXL LABU UVXY using proprietary analysis of volatility. Subscribe to get our latest analysis, trade plans and live intraday trades. Current trade record here. Updates 3 PM ET - Monday 1/17/22 Key Dates Here is the economic calendar for this week. The most important date is OPEX this Friday. Price Projections The table of key price levels has been fully updated. Earnings season has started last week. There is hope for a market boost. But based on our analysis of P/C ratio, volatility and market breadth (see discussions further below), we think the boost may be short-lived. Volatility is very likely to continue rising higher as we approach OPEX this Friday. There is a high probability that we will see price movements as follows this week:
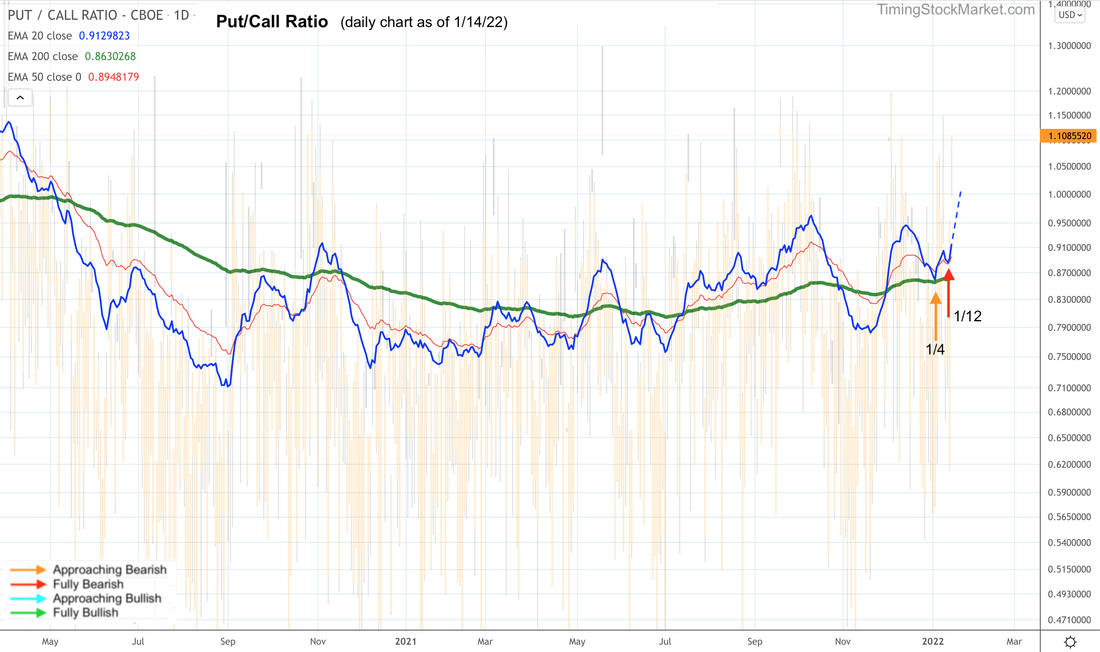
After 1/21, volatility is likely to drop while stock indices start to rise again. But be careful here as there is a rising possibility of a real big volatility spike in the first half of 2022. We will report more on that as the data unfolds. Trade Plan In this environment, we prefer to trade quick positions, and/or intraday positions, until after OPEX. Our plan is a quick trade to capture the bounce, then a bigger quick trade to capture the drop. See updated plan in spreadsheet. Volatility: $VVIX $VIX $VXN $RVX Read more about $VIX $VXN $RVX $VVIX and the effects of options and hedging on the market here. All volatility charts are showing "Fully Bearish" signal. Hedging by Traders: Put/Call Ratio The signal from P/C ratio chart is now "Fully Bearish". Hedging by Dealers Below are the updated volatility trigger levels. If price is above the trigger level, dealer hedging will change from "fueling volatility" (big price swings) to "dampening volatility" (calm price movements).
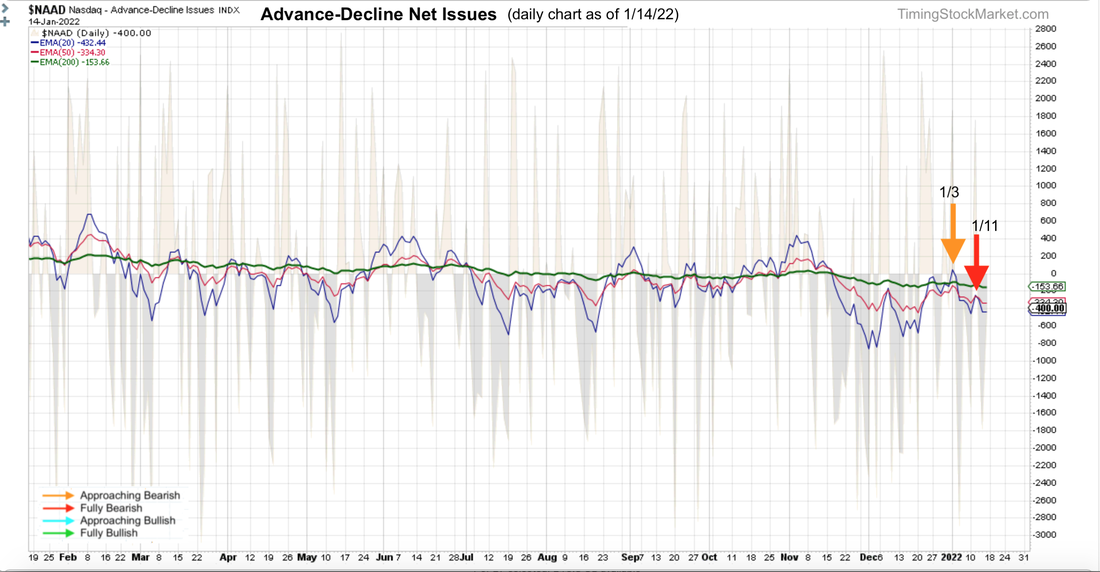
The Deep January Options Expiration On OPEX Friday 1/21, there are deep in the money calls worth over $125 billions set to expire. The magnitude of this expiration is likely a catalyst for volatility. Even if you don't trade options, this big wave is going to rock your boat. So we recommend that you read the full explanation of this important expiration here. Market Breadth: Advance-Decline Net Issues The 20-day EMA lines on A/D charts for NYSE, Nasdaq and small caps are heading down. The message here is "Fully Bearish". Other Signals for Big Picture Consideration The Dark Pool Index shows silent money has eased up on buying $SPX. We are keeping this in mind, but not assigning a lot of weight to it yet. Bond volatility (MOVE index) continues to form lower high relative to late November. We interpret this to mean that the bond market is not in turbulent mode for now, and consider it a bullish divergence from bond prices. A calm bond market is necessary for a calm stock market to follow. Junk bonds (JNK HYG) is dropping to retest its 1/10 low. On the weekly chart, JNK HYG EMA lines are converging, setting up a vulnerable pattern for junk bonds. This is a bearish warning for stocks. Click here for Signal Trades spreadsheet. To Read We urge you to read this article about risk management and position sizing. 1% Risk Rule If you are new to trading 3x leveraged ETFs like TQQQ TNA SOXL FNGU, read: Why 3x ETFs like TQQQ lose money over the long term If you are new to trading inverse ETFs like SQQQ TZA SOXS FNGD, read: The risks of investing in inverse ETFs Disclaimer The information presented here is our own personal opinion. Consider it as food for thought. We are not offering financial advice. We are not promoting any financial products. We are not registered financial advisers or licensed brokers. We make no guarantee that anything will unfold according to our projections. You are proceeding at your own risk if you follow our suggestions.
0 Comments
Leave a Reply. |
Archives
July 2024
Categories |
 RSS Feed