|
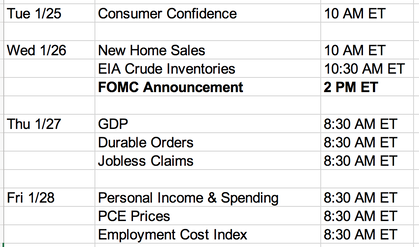
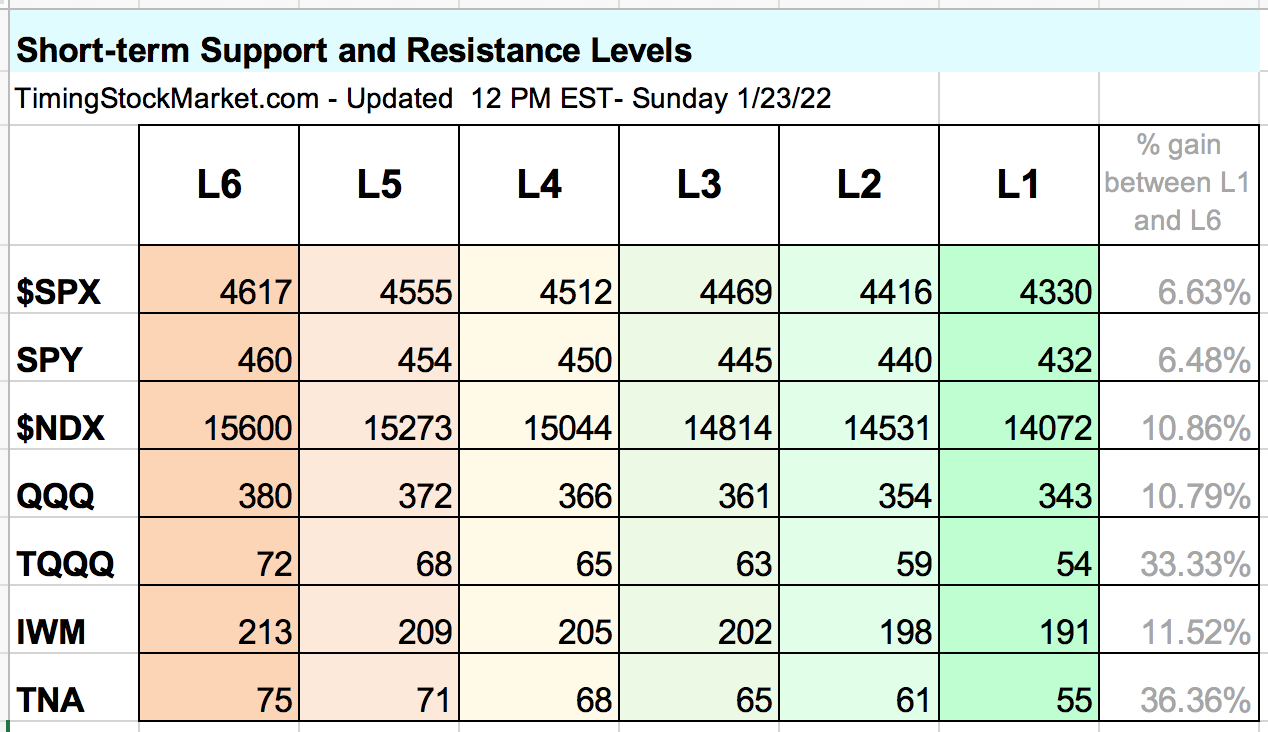
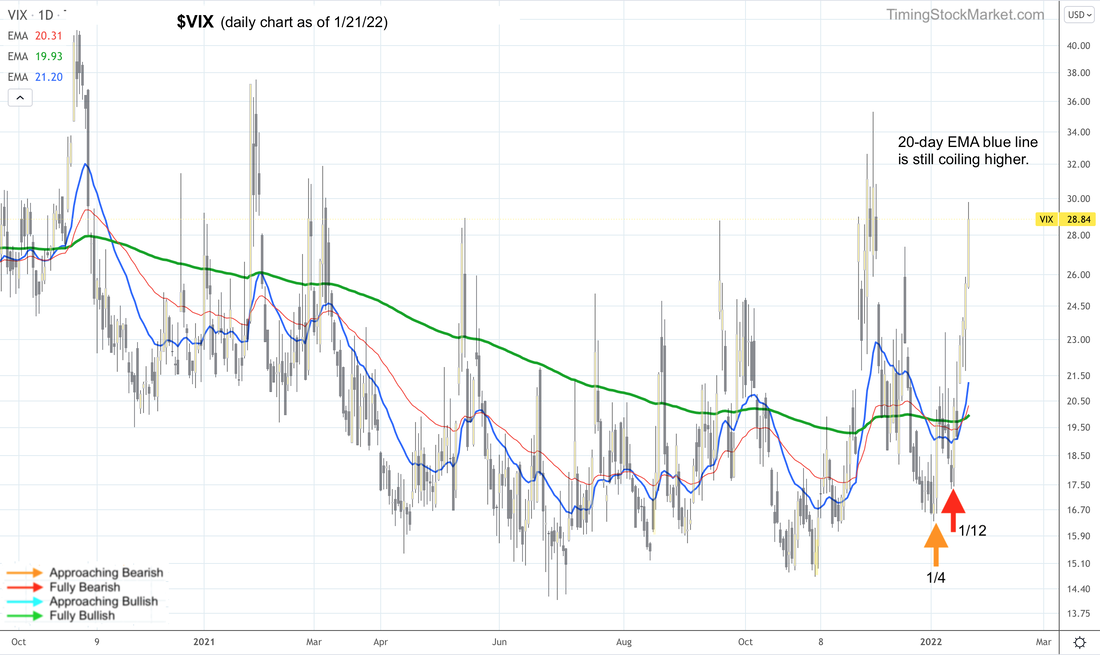
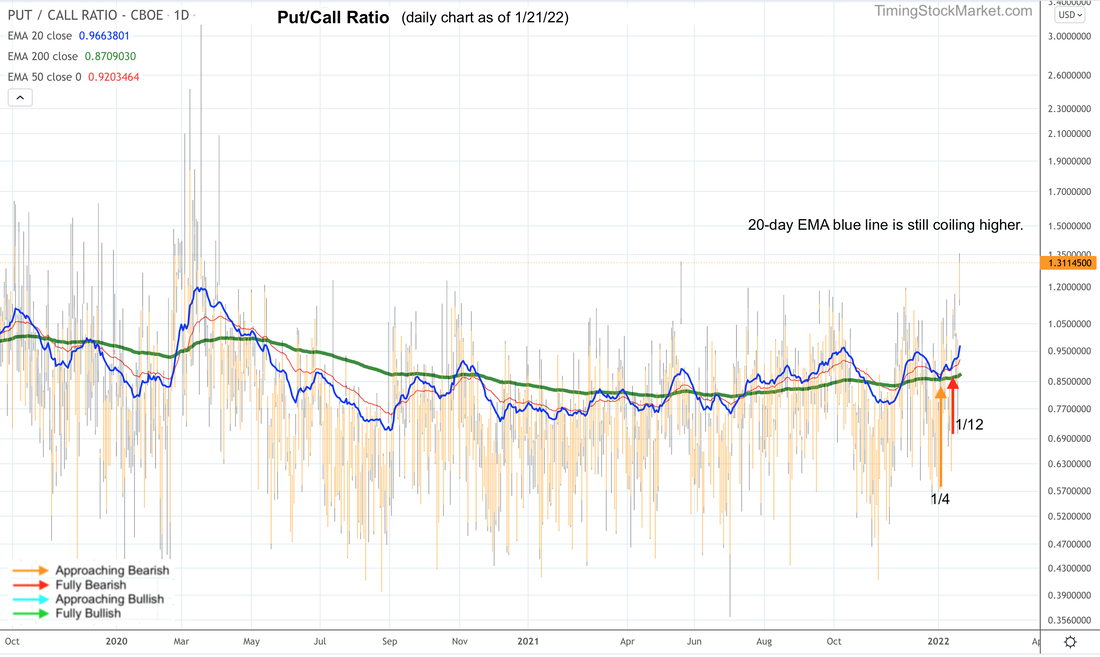
We trade 3x ETFs such as TQQQ TNA SOXL LABU UVXY using proprietary analysis of volatility. Subscribe to get our latest analysis, trade plans and live intraday trades. Current trade record here. Updates 5:45 PM ET - Sunday Key dates this week The big event this week is of course FOMC announcement on Wednesday. In addition, these gorillas are reporting earnings this week: MSFT, TSLA, AAPL. Their earnings will either be the catalysts to end the sell-off, or fuel to continue the meltdown. Expectations for this week Our system composite signal technically turned "Fully Bearish" on 1/11. And stocks have been selling off hard since then. We must confess that we underestimated the magnitude of this sell-off. At this point, the signal is still "Fully Bearish", which means more selling ahead, until the signal changes to "Approaching Bullish". However, market conditions have reached extreme oversold. So we are likely to see a bit of stabilizing and possibly a relief rally early in the week, ahead of FOMC. Depending on what the Fed says on Wednesday, there's a chance the relief rally can turn into a real rally. But the Fed may fumble it, and trigger a meltdown in the market. This is what happened back in December 2018. So stay nimble. Key price levels The table below is fully updated. Trade Plan We are planning on two different trades for this week. On Monday, we will monitor for the setup for a bounce in TQQQ. This will be a single quick trade, possibly from L1 to L3. Regardless of how high TQQQ can rise, we will exit this trade ahead of FOMC. Note that if the signal remains "Fully Bearish" while UVXY SQQQ TZA pull back (due to $SPX $NDX IWM bounce), it's a setup for re-entering UVXY SQQQ TZA. But we won't enter this bearish setup, or anything, ahead of FOMC. Simply too risky. Instead we will be monitoring for post-FOMC market reactions, and the setup of the next trade based on that. Click here for Signal Trades spreadsheet. Volatility: $VVIX $VIX $VXN $RVX Read more about $VIX $VXN $RVX $VVIX and the effects of options and hedging on the market here. All volatility charts show "Fully Bearish" signal right now. The 20-day EMA blue line is still coiling higher, confirming the bearishness. However, a big spike formed last week. So volatility may be getting close to starting the topping process. Hedging by Traders: Put/Call Ratio The signal from P/C ratio chart is still "Fully Bearish". We need to see at least a "same-high" or "lower-high" pattern from P/C ratio chart for this signal to edge towards "Approaching Bullish". Unfortunately, the 20-day EMA blue line is still coiling higher. So nothing has changed yet. Hedging by Dealers Stock market has been in a vicious cycle since the sell-off started. Steady selling triggered margin calls and panic in traders. So they sell calls and buy puts. Dealers have to take the other side of those trades, and they have to hedge their books to stay neutral. Dealer hedging in this case results in them selling into weakness and buying into strength. This causes volatility to rise. Rising volatility makes traders panic even more. So they sell more calls and buy more puts. And on it goes. Below are the updated volatility trigger levels.
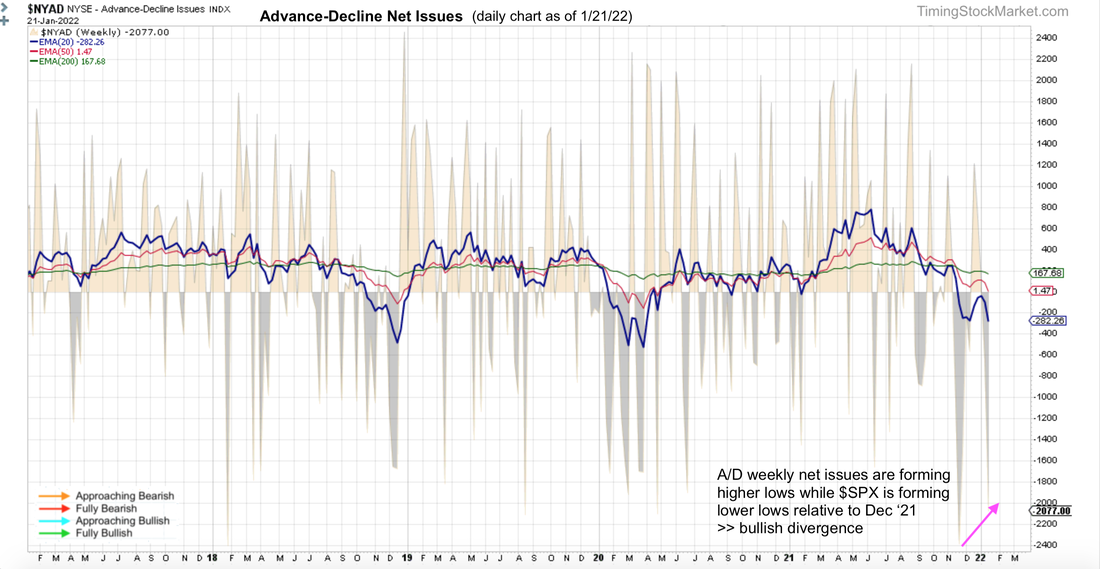
Market Breadth: Advance-Decline Net Issues The signal for all A/D charts based on their EMA lines are all "Fully Bearish" right now. But we have been noticing this pattern. NYSE A/D weekly net issues are forming higher lows while $SPX is forming lower lows relative to Dec ‘21. This is possibly a very early bullish divergence. Keep an eye on this, but don't hold your breath. Other Signals for Big Picture Consideration The Dark Pool Index shows silent money has not been actively buying $SPX. Bond volatility (MOVE index) is ended last week with a clear lower high pattern, relative to its November peak. This may be short-term topping process for bond volatility, and if true, it is an early bullish divergence for stocks from bond messages. In fact, bond ETF (TLT IEF LQD) weekly charts show that they have formed bullish candles at key support levels last week. One could argue that money is rotating into bonds for safety. But the fact that big money is buying bonds at all in the face of sharply rising rates and inflation is a good thing for the financial system overall. Click here for Signal Trades spreadsheet. To Read We urge you to read this article about risk management and position sizing. 1% Risk Rule If you are new to trading 3x leveraged ETFs like TQQQ TNA SOXL FNGU, read: Why 3x ETFs like TQQQ lose money over the long term If you are new to trading inverse ETFs like SQQQ TZA SOXS FNGD, read: The risks of investing in inverse ETFs Disclaimer The information presented here is our own personal opinion. Consider it as food for thought. We are not offering financial advice. We are not promoting any financial products. We are not registered financial advisers or licensed brokers. We make no guarantee that anything will unfold according to our projections. You are proceeding at your own risk if you follow our suggestions.
0 Comments
Leave a Reply. |
Archives
July 2024
Categories |
 RSS Feed