|
We trade 3x ETFs such as TQQQ TNA SOXL LABU UVXY using proprietary analysis of volatility. Subscribe to get our latest analysis, trade plans and live intraday trades. Current trade record here. Updates 2:30 PM ET - Sunday Upcoming key dates This week is light in economic reports, but there is a big one on Thursday. CPI numbers will undoubtedly move the market one way or another. 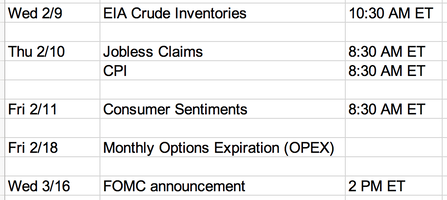 Projections for February You may have noticed that volatility moves in cycles that spans the following 4 phases, typically within a one month period.
Currently our system composite signal is still "Approaching Bullish". There is a high probability that we will see the following scenario.
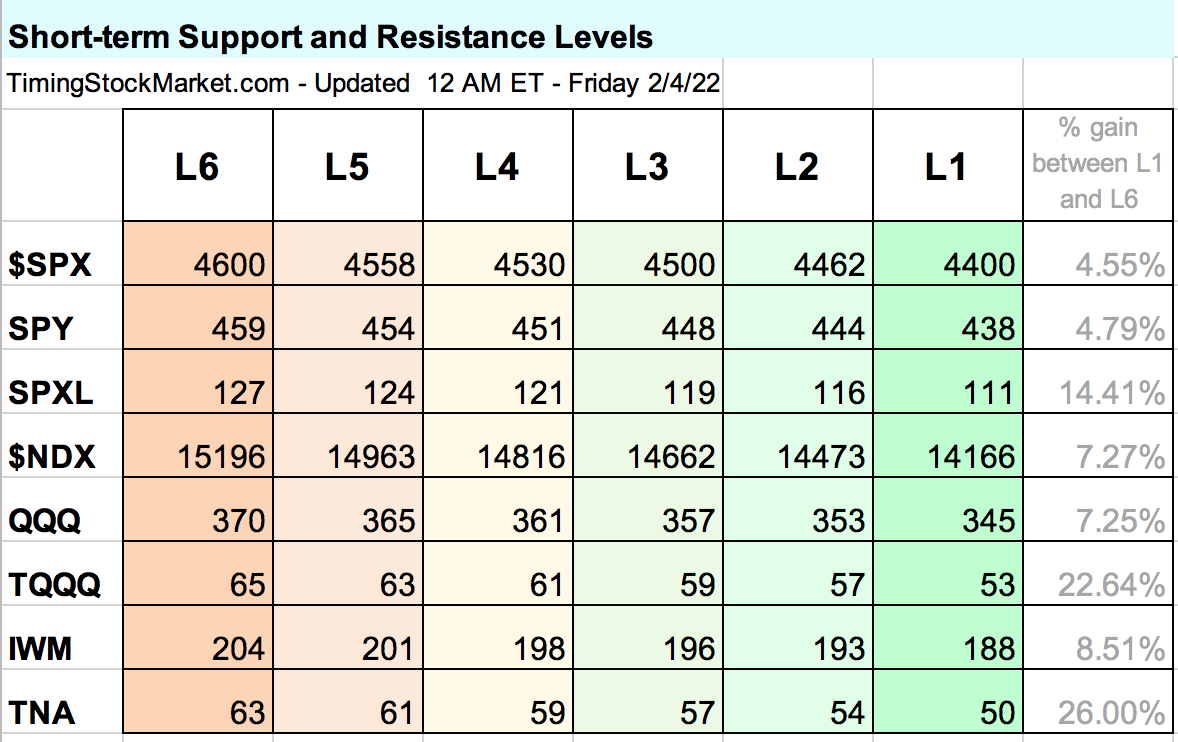
Please keep in mind that these are projections, not guarantees. But we do think that the volatility cycle will traverse through some kind of timeframe similar to above. When will the next big sell-off be? No one can really predict this. However, there is one indicator we can monitor that is fairly reliable. Keep an eye on $VIX when our signal turns "Fully Bullish", most likely this week. If this bullish cycle approaches its end without $VIX dropping below 18, $VIX may be setting itself up for a really big spike that can reach 44 - 45. If this happens, $SPX $NDX IWM can drop lower than 1/24 levels. Key price levels This table was last updated on 2/4.
 Trade Plan Given that $VIX is likely to spike up quickly at the start of the week, we will do a quick trade to capture this spike in $VIX and the corresponding drop in IWM. Once the composite signal turns “Fully Bullish”, we will place buy orders to scale into SPXL and TQQQ between L1 and L2. Click here for Signal Trades spreadsheet. Volatility: $VVIX $VIX $VXN $RVX Read more about $VIX $VXN $RVX $VVIX here. All volatility charts have turned "Approaching Bullish" by end of 1/24. This signal is still intact. Last Sunday we wrote: looking for $VVIX chart pattern to anchor at or below its 200-hour EMA green line. That is exactly what $VVIX did this past week. Now $VVIX should form a quick lower-high spike (relative to 1/24). This will shake out the weak hands and turn the signal "Fully Bullish". 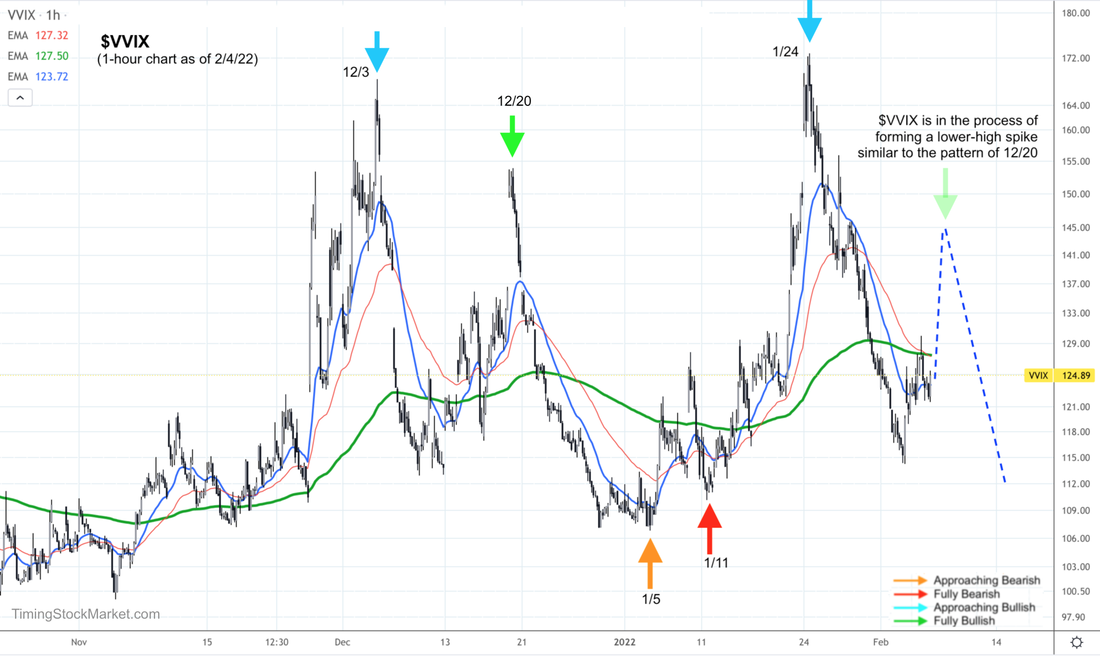 Hedging by Traders: Put/Call Ratio The signal from P/C ratio chart has turned "Approaching Bullish" by end of 1/24. This signal is still intact. In P/C ratio daily chart below, its 20-day EMA is forming a flat top. This indicates that the signal is getting close to turning "Fully Bullish". 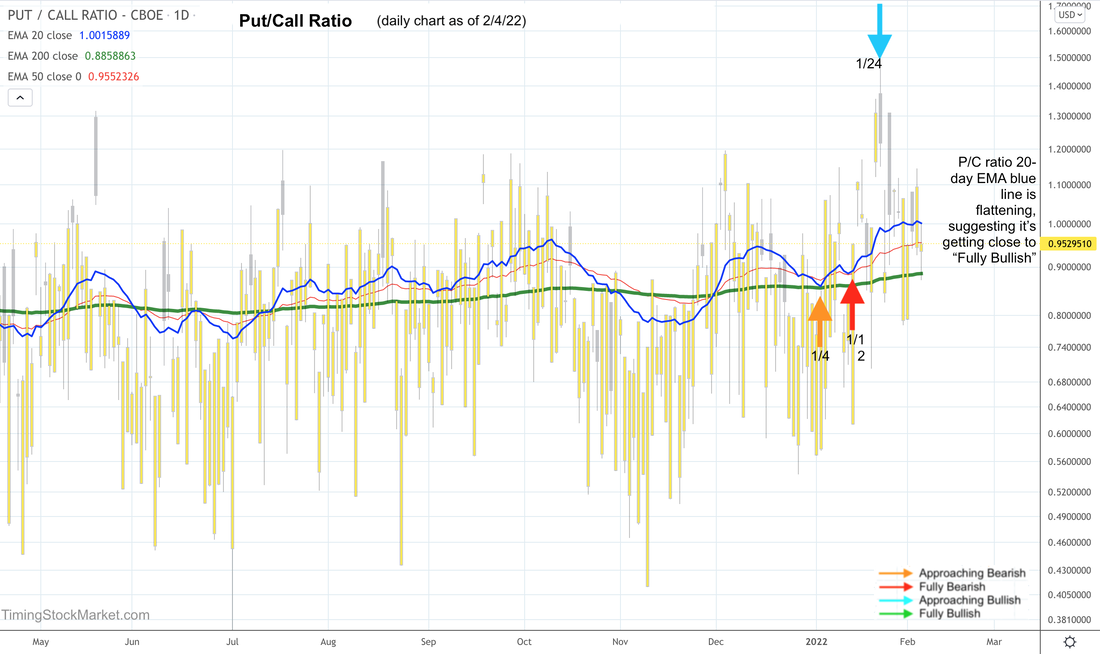 Hedging by Dealers Read more about how options are impacting the market and the effects of dealer hedging here. Below are the updated volatility trigger levels.
As of this writing, all indices are still below their trigger levels. This means dealer hedging will fuel volatility rather than dampen it. So expect big price swings to continue both up and down. Market Breadth: Advance-Decline Net Issues And now some good news for the bulls. The signal for all A/D charts have changed to "Fully Bullish" by end of 2/4. This bolsters our thesis that the composite signal is about to turn "Fully Bullish", after one more volatility spike to shake out the weak hands. 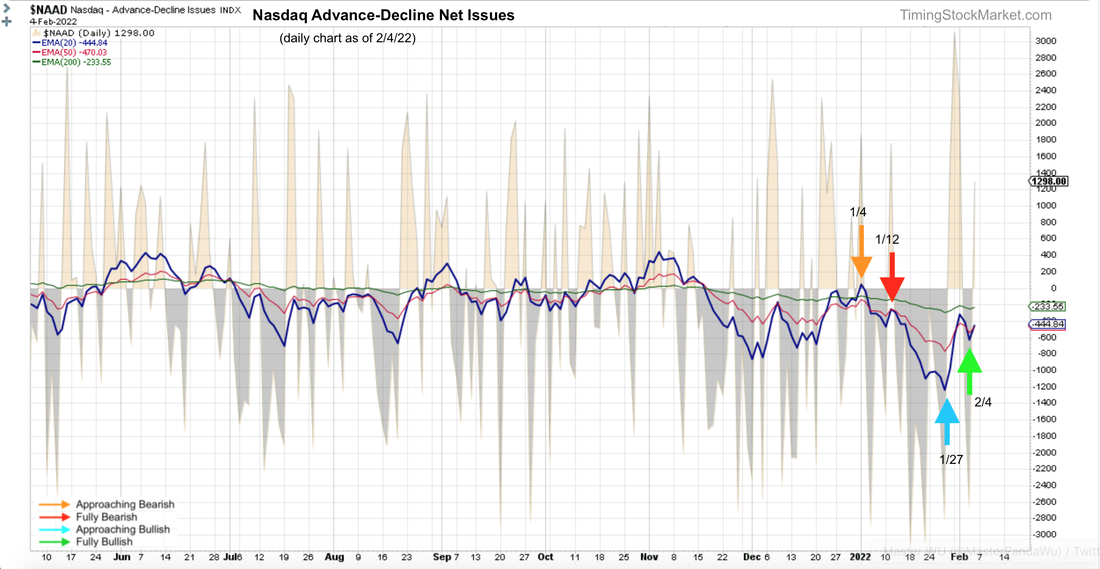 Other Signals for Big Picture Consideration The Dark Pool Index (DIX) shows silent money had a huge bullish reversal early last week. The buying has eased up somewhat, but is still continuing steadily throughout the week. This is an important under-the-hood bullish indicator for the short term. However, price actions in the bond market were quite bearish last week. Bond volatility is grinding upward slowly. These are not bullish long-term signals for stocks. Click here for Signal Trades spreadsheet. To Read We urge you to read this article about risk management and position sizing. 1% Risk Rule If you are new to trading 3x leveraged ETFs like TQQQ TNA SOXL FNGU, read: Why 3x ETFs like TQQQ lose money over the long term If you are new to trading inverse ETFs like SQQQ TZA SOXS FNGD, read: The risks of investing in inverse ETFs Disclaimer The information presented here is our own personal opinion. Consider it as food for thought. We are not offering financial advice. We are not promoting any financial products. We are not registered financial advisers or licensed brokers. We make no guarantee that anything will unfold according to our projections. You are proceeding at your own risk if you follow our trades.
0 Comments
Leave a Reply. |
Archives
July 2024
Categories |
 RSS Feed
|
|
Copyright (c) 2019-2024 LOOK Systems LLC
All rights reserved. |