|
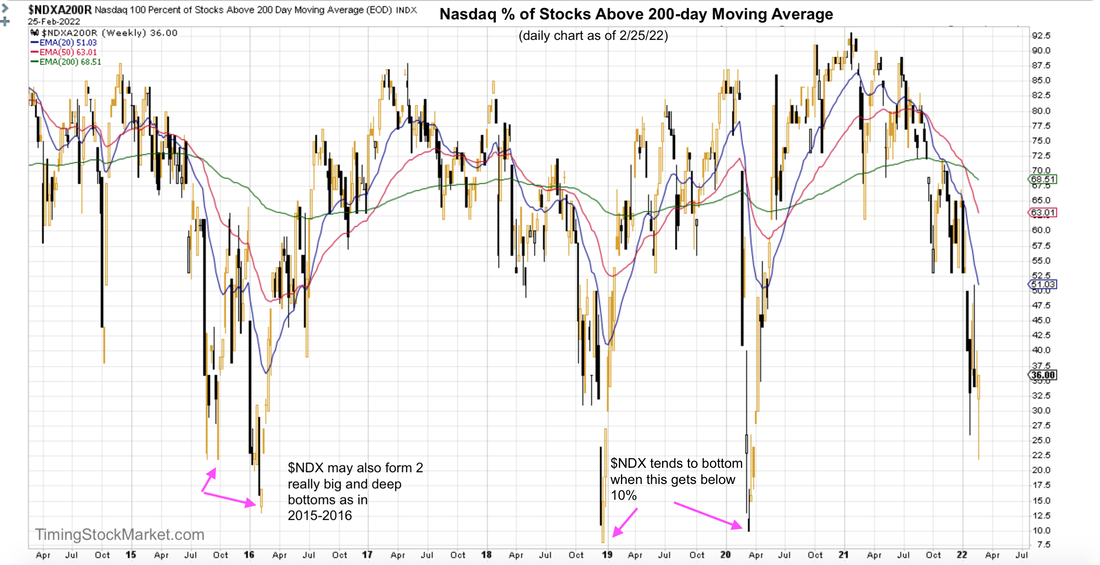
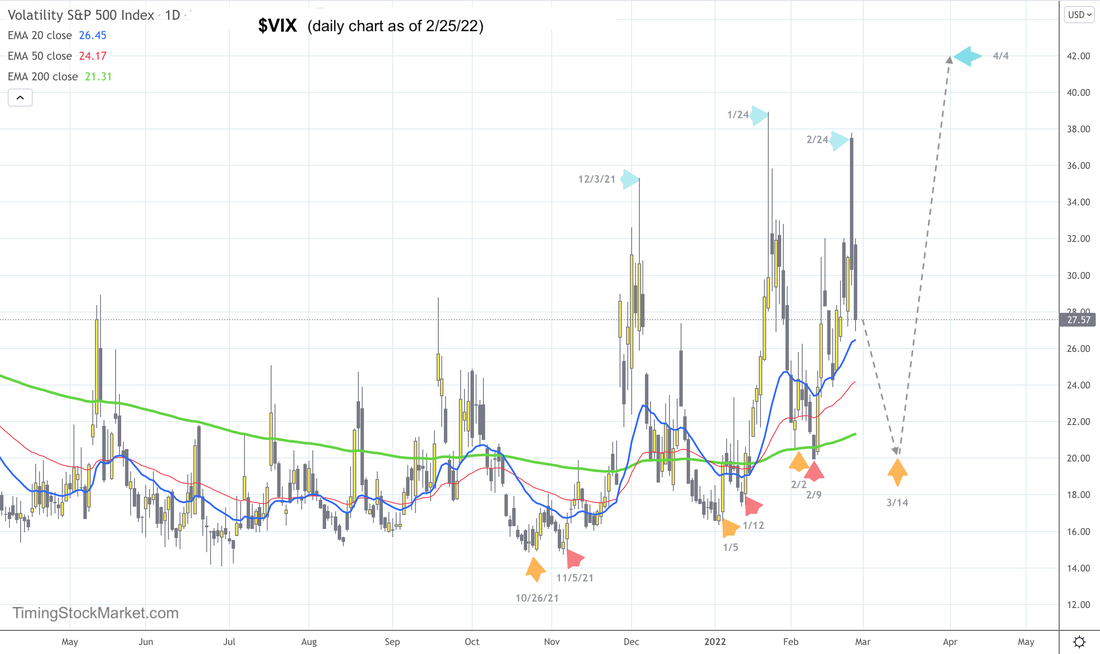
We trade 3x ETFs such as TQQQ TNA SOXL LABU UVXY using proprietary analysis of volatility. Subscribe to get our latest analysis, trade plans and live intraday trades. Current trade record here. Updates 2:15 PM ET - Sunday Big Picture: Has the bear market ended yet? While the bear market rally that started last week helps to ease market anxiety, in the context of the multi-month big picture, market is still in a bearish phase. And it's not done being bearish yet. Here are 3 things to keep an eye on that will tell us when this bear market will bottom. First, we need to see a lot more call buying from traders and fund managers. Last week's massive rally was mostly due to short covering by traders and dealers. These shorts were a result of big demands for hedging puts from traders and fund managers. There's still no sign of increasing demands for calls yet. We don't have a healthy start to a bull market until traders are eagerly buying calls. Second, the percentage of Nasdaq happy stocks (stocks that are above their 200-day MA) should drop to 10% or lower. Or else there should be a huge double bottom as shown in the chart below. Climatic moments in a bear market do not typically arrive at 36%, which is where we are right now. Third, we need to see one more really scary volatility spike. So far we've only had two:
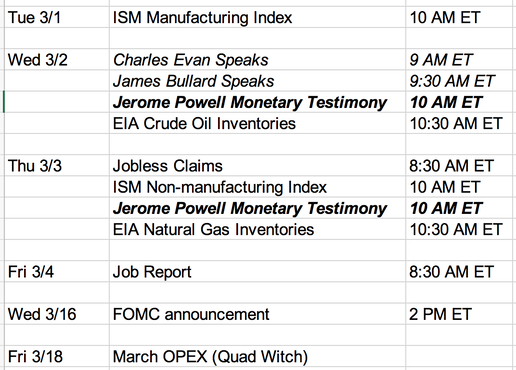
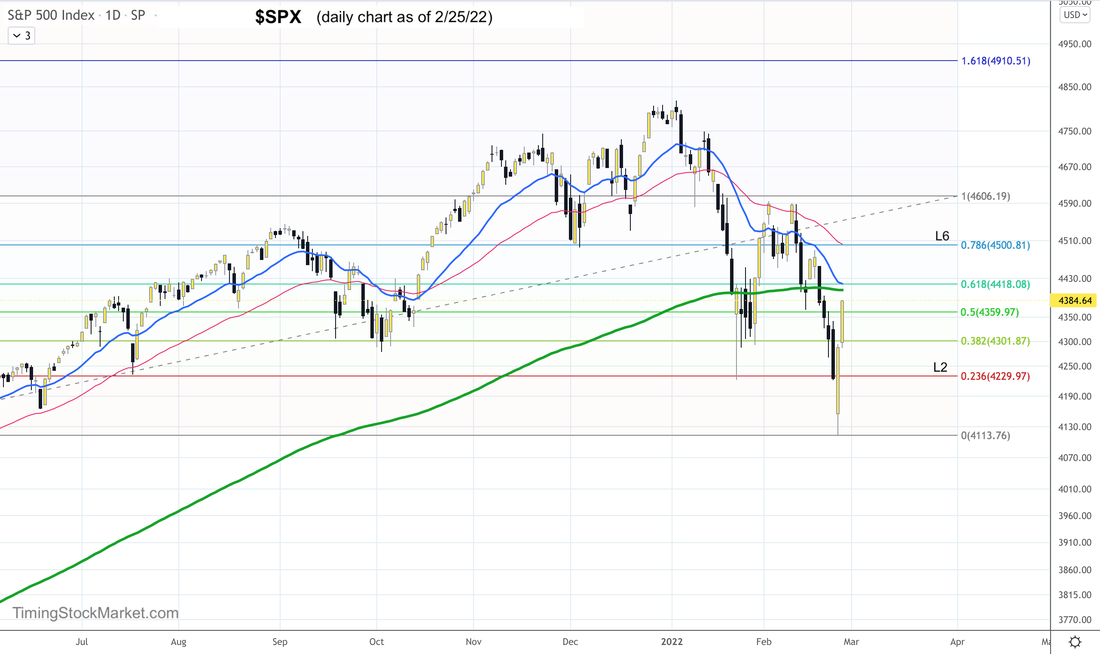
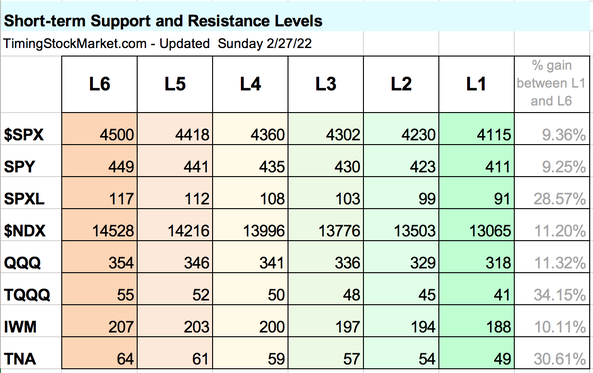
The interim spike between 2/9 and 2/24 does not qualify as the scary peak. We need one more volatility spike that forms a higher high from 1/24 peak. Here is our projection for this 3rd spike in the chart below. (Read more about $VIX $VXN $RVX $VVIX here.) How much lower can market drop to? $SPX 4115 low from last week provides strong short-term support for this week. But ultimately, when the 3rd volatility spike peaks, we may see $SPX bottoms out at 3875. These are our projections, and we may turn out to be dead wrong. In fact, our inner bull really hopes to be wrong about $SPX 3875. But we've been through enough bear market to know that the $SPX at 4115 is not low enough or scary enough to qualify as the bottom. Short Term: Key events this week and next week The key market moving event this week will be Jerome Powell monetary policy testimony to Congress on Wednesday and Thursday. This comes one week before FOMC announcement on 3/16, and sandwiched in between is the job report this Friday. With the Russian sanctions and continuing fighting in Ukraine, a lot of attention may be paid to the oil and gas reports as well. Short Term: Bear market rally to continue this week Looking at $SPX levels as short-term guide posts, we think that $SPX is likely to peak at 4500 prior to FOMC on 3/16. Again, using $SPX levels as guide posts, here are 2 scenarios to look for. Steady: $SPX retests 4230 and then rises up steadily to 4500. Then it chops for a bit before dropping post FOMC. Choppy: $SPX continues to surge quickly up to 4500. Then it spends most of this week and early next week chopping, before dropping post FOMC. Short-term: Key price levels The table below has been fully updated. These are short-term key price levels to help guide your trade plan for this week. Trade plan Click here for live trades. So basically we expect the bear market rally that started last week to continue this week. We want to capture this rally if $SPX $NDX IWM retest L2. See the spreadsheet for TQQQ and TNA rally trades. We will also trade quick intraday positions that are initiated at open, based on futures ES NQ RTY chart patterns formed overnight. These are discretionary trades and we'll post them early if we spy something good. Supplemental data: Trader Hedging (Equity Put/Call ratio) On the daily chart, equity put/call ratio EMA lines are still all rising. This tells us that market participants are still buying and holding on to their puts. Supplemental data: Market Breadth (Advance-Decline net issues) A/D cumulative lines improved substantially for NYSE and Nasdaq and small caps last Thursday and Friday. Still the patterns on these charts are not the typical bear market bottom patterns yet. It is worth noting that small caps actually has the most bullish chart of all. Supplemental data: Hedging by Dealers Read more about how options are impacting the market and the effects of dealer hedging here. Below are the updated volatility trigger levels from Spotgamma.
As of this writing, $NDX IWM have managed to rise above their trigger levels. So we may see calmer price movements this week. However, we have noticed that these trigger levels change rapidly. And in this put-heavy bear market, bullish moods are fragile. Headlines and dealer hedging can still create big whipsaw. Supplemental data: Dark Pool Index (DIX) The good news for the bulls is the Dark Pool Index shows silent money has resumed buying $SPX. They've been at it since 1/25, with some easing early last week. This is a very strong bullish divergence for $SPX. We trade 3x ETFs such as TQQQ TNA SOXL LABU UVXY using proprietary analysis of volatility. Subscribe to get our latest analysis, trade plans and live intraday trades. Current trade record here.
0 Comments
Leave a Reply. |
Archives
July 2024
Categories |
 RSS Feed