|
We trade 3x ETFs such as TQQQ TNA SOXL LABU UVXY using proprietary analysis of volatility. Subscribe to get our latest analysis, trade plans and live intraday trades. Current trade record here. Updates 11 PM - Sunday Short Term: Upcoming key events This is a week of light data, but traders will pay close attention to the oil report on Wednesday, and on Thursday all eyes will be on CPI data. 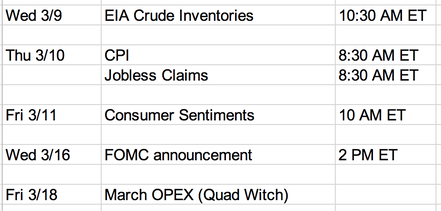 Big Picture: Bear market Futures ES NQ RTY are dropping sharply as we write this. There is a good chance that $SPX $NDX IWM will gap down big at open. The best hope for the bulls at this point is for all indices to retest 2/24 lows, find enough buyers there to stage a real bullish reversal. While our inner bull is hoping for this scenario to come true, we must confess that there are precious few fundamental catalysts to reverse the market soon. In fact, they are all down right negative.
There are analysts arguing that the market is so oversold at this point that it has got to start going up soon. We agree on the oversold part, and we really hope that $SPX will bounce at 4115. Unfortunately, the chart below shows that $SPX may go all the way to 3985 before the end of March. 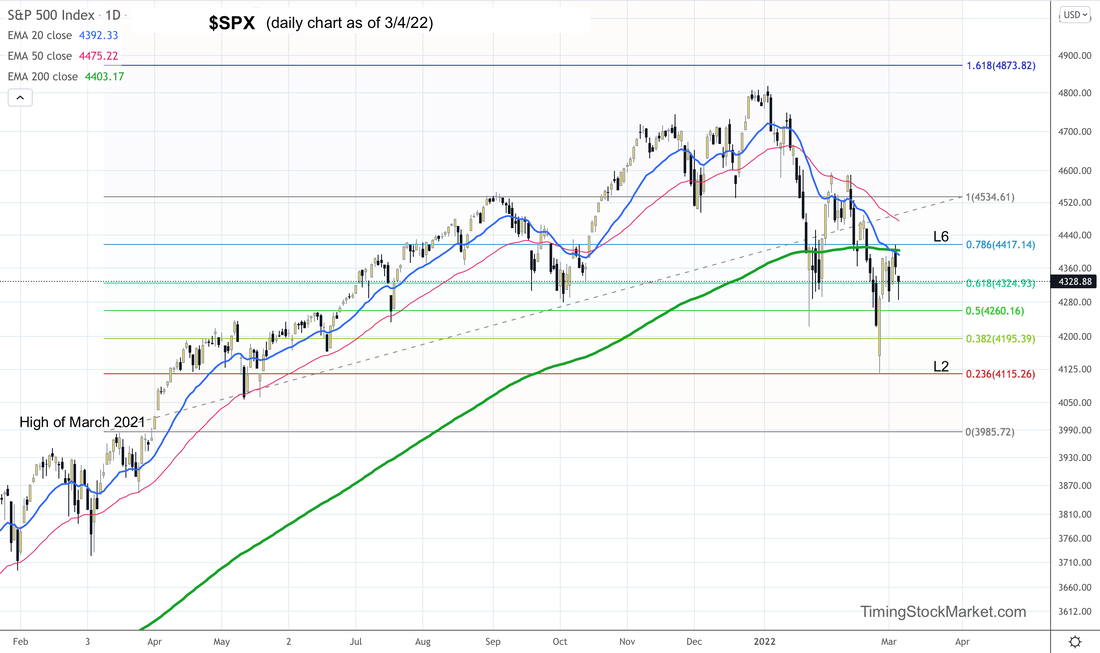 But the end may be here soon according to $VIX Having laid out a very bearish scenario, we should point out that $VIX chart shows volatility has been through 3 major spikes already since late August last year. $VIX is getting ready to do the 4th spike, possibly up to 44. But that may be the last spike in this bearish cycle. 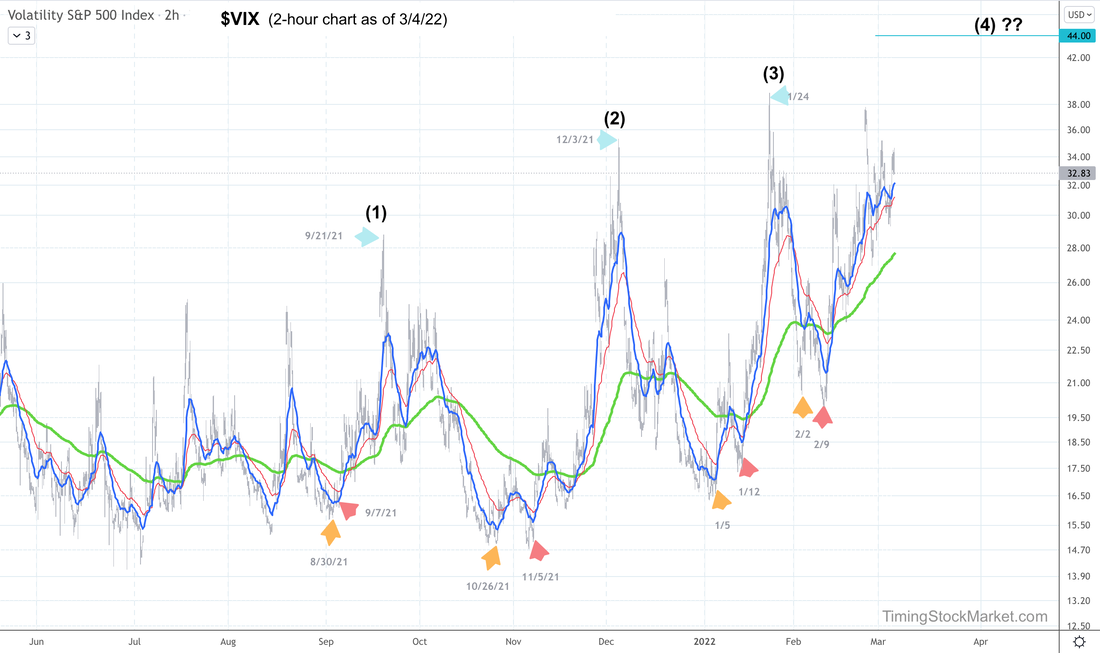 The end will come when only 10% of Nasdaq stocks are happy The percentage of "happy stocks" here refers to percentage of Nasdaq stocks that are above their 200-day EMA. The weekly chart below shows a current reading of 30%. We suspect with the selling this week, this number may get down closer to 10% soon. This is actually good news for the bulls. If it gets down to 10% or lower, a real bottom is likely to be in. This means a possible new bull market segment for Nasdaq stocks. For comparison, the Nasdaq crash of 2002-2003 bottoms out in July 2002, and that's when the chart below read 10%. 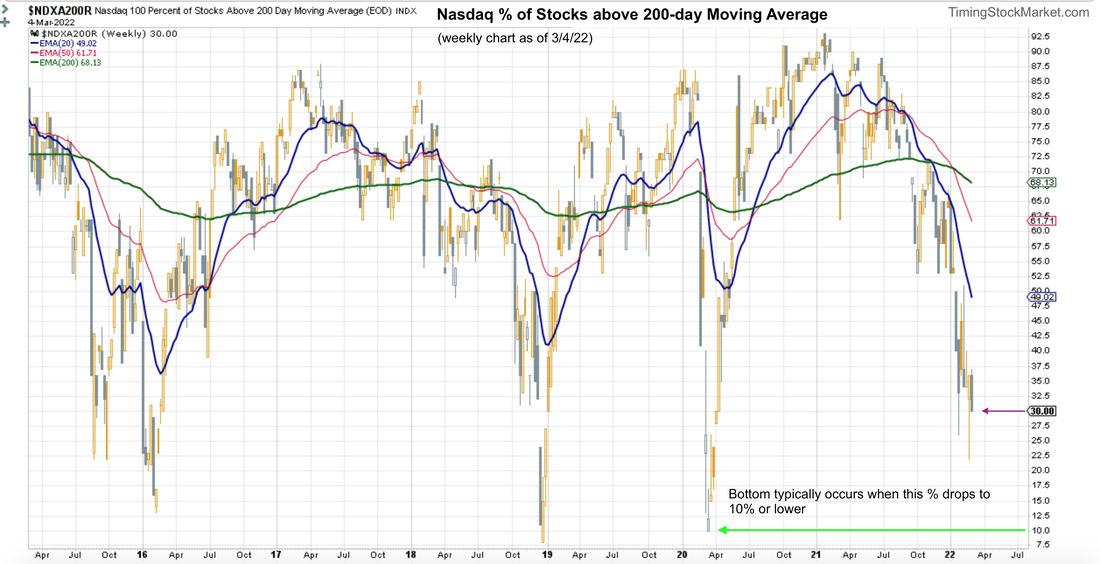 Short-term: Key price levels The table below has been fully updated. These are short-term key price levels to help guide your trade plan for this week. Note that all the levels have been lowered. L6 is the high of last week, L2 is the low of 2/24, and L1 is very strong support, and a possible bottom. 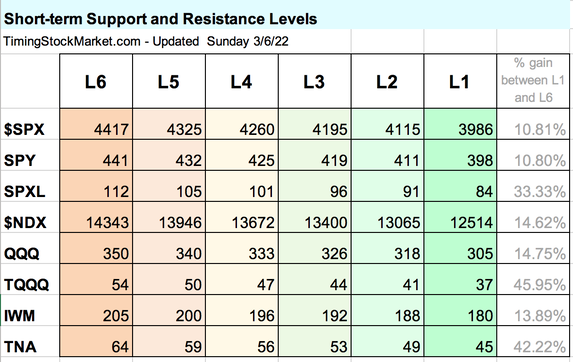 Trade plan Click here for live trades. We will be looking for pullbacks in SQQQ to enter for multi-day position this week. The goal is to capture $NDX drop to L2 or possibly L1. We will also trade quick intraday positions that are initiated at open, based on futures ES NQ RTY $VIX chart patterns formed overnight. Supplemental data: Trader Hedging (Equity Put/Call ratio) On the daily chart, equity put/call ratio EMA lines are still all rising. This tells us that market participants are still buying and holding on to their puts. Supplemental data: Market Breadth (Advance-Decline net issues) A/D cumulative lines look bearish for all indices, especially $NDX. But the pattern has gone into extreme oversold mode. So there is a good chance that $NDX getting close to bottom. Supplemental data: Hedging by Dealers Read more about how options are impacting the market and the effects of dealer hedging here. Below are the updated volatility trigger levels from Spotgamma.
As of this writing, all three indices are below their trigger levels. This means that dealer hedging will fuel volatility, adding to the big price swings in both directions. Supplemental data: Dark Pool Index (DIX) The Dark Pool Index shows silent money is still buying $SPX. They've been at it since 1/25, and has eased up the buying intensity. But they are still buying. This is a very strong bullish divergence for $SPX. We trade 3x ETFs such as TQQQ TNA SOXL LABU UVXY using proprietary analysis of volatility. Subscribe to get our latest analysis, trade plans and live intraday trades. Current trade record here.
0 Comments
Leave a Reply. |
Archives
July 2024
Categories |
 RSS Feed
|
|
Copyright (c) 2019-2024 LOOK Systems LLC
All rights reserved. |